
Figure 2.
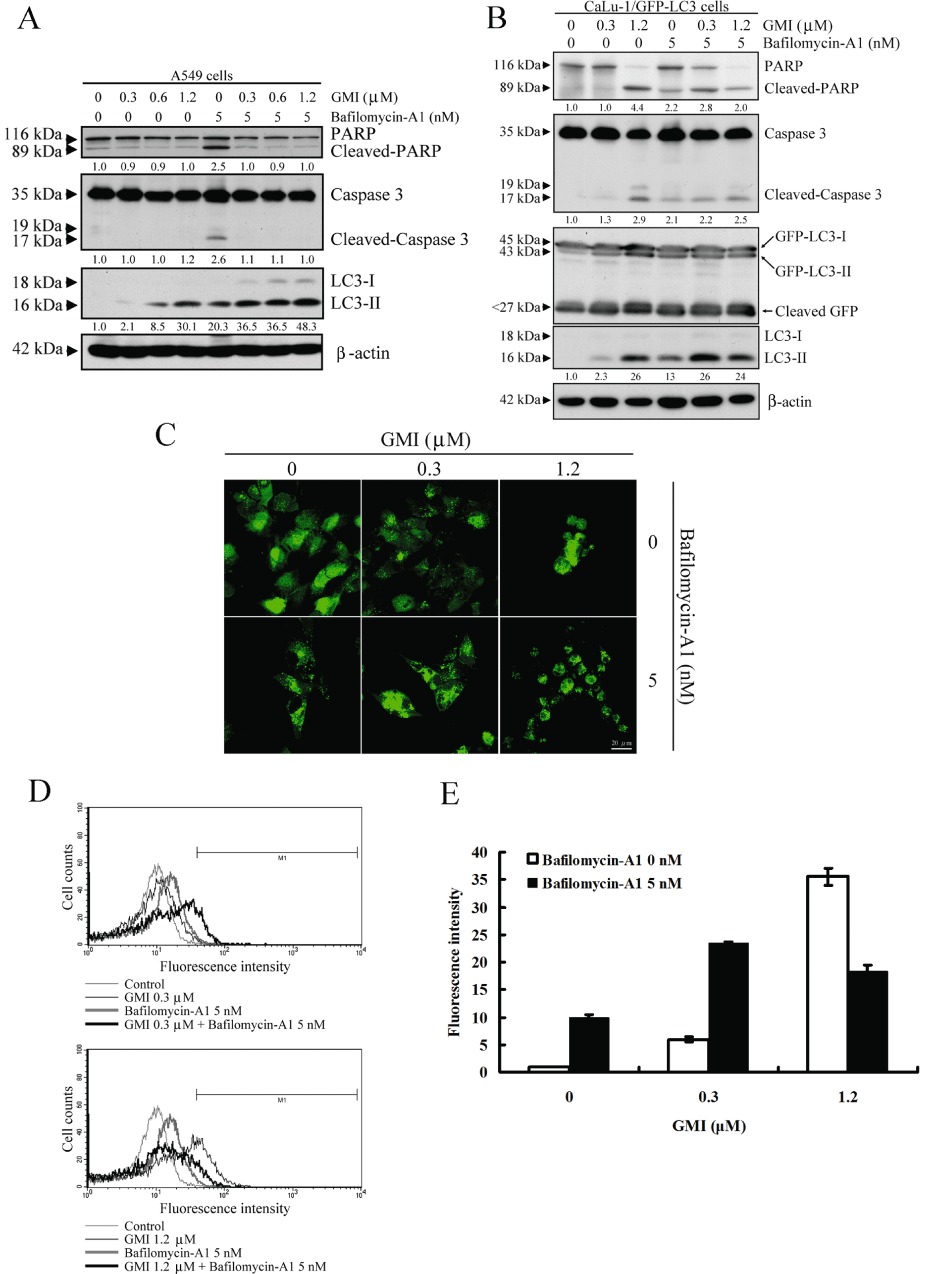
Effect of bafilomycin-A1 and GMI co-treatment on apoptosis and autophagosome accumulation in non-small cell lung cancer NSCLC cells. (A) PARP, caspase 3 cleavage and LC3 conversion were determined on Western blot after A549 cells (2 × 10⁵ cells per 35 mm dish) were treated with 5 nM bafilomycin-A1 and various concentrations of GMI for 48 h. β-Actin is a loading control. (B) Changes in PARP and caspase 3, and conversions of GFP-LC3 and endogenous LC3 in GMI and bafilomycin-A1-treated CaLu-1/GFP-LC3 cells (2 × 10⁵ cells per 35 mm dish) were detected on Western blot. β-Actin is a loading control. The software ImageJ was used to quantify the band intensity of cleaved PARP, cleaved caspase 3 and LC3-II. The data showed the relative expression standardized by the β-actin protein level, and the ratio without GMI and bafilomycin-A1 treatment was set at 1. (C) CaLu-1/GFP-LC3 cells (5 × 10⁴ cells per well of 24-well plate) were treated with 5 nM bafilomycin-A1 and various concentrations of GMI for 48 h. The GFP-LC3 dots induced by GMI and bafilomycin-A1 in CaLu-1/GFP-LC3 cells were observed under confocal microscope. Scale bar indicates 20 µm. (D) After bafilomycin-A1 (0, 5 nM) and GMI (0, 0.3 and 1.2 µM) treatment for 48 h, CaLu-1/GFP-LC3 cells (5 × 10⁵ cells per 60 mm dish) were harvested with trypsin-EDTA. The relative level of GFP-LC3 fluorescence intensity was analysed by flow cytometry. (E) Quantification of cells developing GFP-LC3 dots in CaLu-1/GFP-LC3 cells. The percentages of developed GFP-LC3 dots in GMI- and bafilomycin-A1-treated CaLu-1/GFP-LC3 cells were calculated based on the results of fluorescence-activated cell sorting assay.