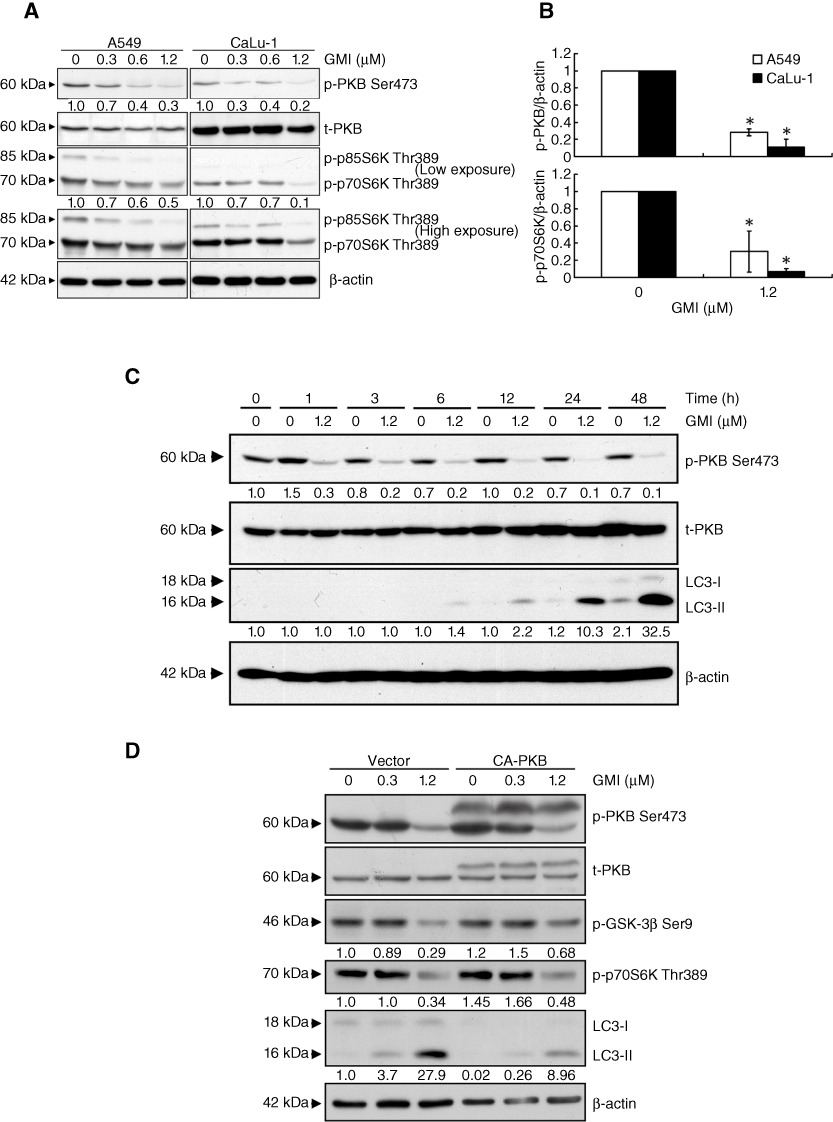
Figure 3.

Effect of the PKB/mTOR signalling pathway in GMI-mediated autophagy in non-small cell lung cancer cells. (A) A549 and CaLu-1 cells (2 × 10⁵ cells per 35 mm dish) were treated with GMI (0, 0.3, 0.6 and 1.2 µM) for 48 h. Equal amounts of total cell lysates were subject to immunoblotting with anti-phospho-PKB, anti-PKB and anti-phospho-p70S6K. β-Actin is a loading control. (B) Statistical analysis of Western blotting. The protein levels of p-PKB and p-p70S6K were standardized by the β-actin protein level, and each value is expressed as an intensity showing the ratio of the expression in A549 and CaLu-1 cells treated with GMI to that in untreated cells. The ratio of cells without GMI treatment was set at 1. The symbol (*) indicates P < 0.05 by Student's t-test. (C) A549 cells (2 × 10⁵ cells per 35 mm dish) were treated without or with 1.2 µM GMI for various time periods (0, 1, 3, 6, 12, 24 and 48 h). Protein loading was determined by Western blot against β-actin. (D) A549 cells (1 × 10⁵ cells per 35 mm dish) transfected with empty vector or constitutively active PKB (CA-PKB) expression vector for 24 h were treated with various concentrations of GMI (0, 0.3 and 1.2 µM) for 48 h. Phospho-PKB, PKB, phospho-GSK-3β, phospho-p70S6K expression and LC3 conversion were determined on Western blot. The software ImageJ was used to quantify the band intensity.
