
Figure 4.
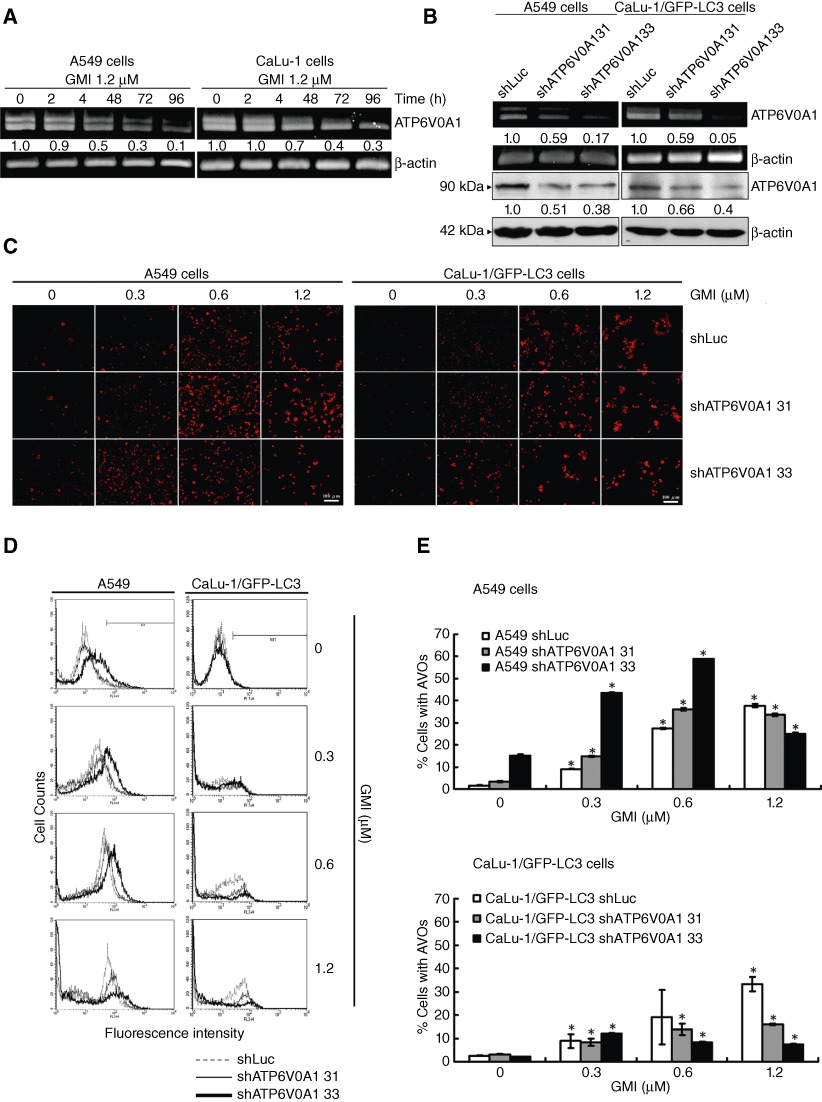
Effect of ATP6V0A1 silencing on GMI-induced acidic vesicular organelle (AVO) development in non-small cell lung cancer cells. (A) A549 and CaLu-1 cells (5 × 10⁵ cells per 60 mm dish) were treated without or with 1.2 µM GMI for various time periods (0, 24, 48, 72 and 96 h). The total RNA was reverse-transcribed into cDNA, and the expressions of ATP6V0A1 and β-actin were analysed by PCR. (B) Total RNA and cell lysate were collected from A549 shLuc, A549 shATP6V0A1, CaLu-1/GFP-LC3 shLuc and CaLu-1/GFP-LC3 shATP6V0A1 cells. ATP6V0A1 expression was observed by RT-PCR and Western blot. β-Actin served as an internal control. The software ImageJ was used to quantify the band intensities of ATP6V0A1. (C) Acridine orange was used to stain AVOs in A549 shLuc, A549 shATP6V0A1, CaLu-1/GFP-LC3 shLuc and CaLu-1/GFP-LC3 shATP6V0A1 cells (5 × 10⁴ cells per well of 24-well plate) untreated or treated with GMI (0.3, 0.6 and 1.2 µM) for 48 h. The cells were investigated under a red filter fluorescence microscope. Scale bar indicates 100 µm. (D) The indicated cell lines (5 × 10⁵ cells per 60 mm dish) were treated with GMI for 48 h, followed by staining with acridine orange. The fluorescence-activated cells were analysed by flow cytometry. (E) Quantification of cells with AVO development in indicated cell lines. The percentages of developed AVOs in GMI-treated cells were calculated based on the results of fluorescence-activated cell sorting assay. The symbol (*) indicates P < 0.05 by Student's t-test.