
Figure 4.
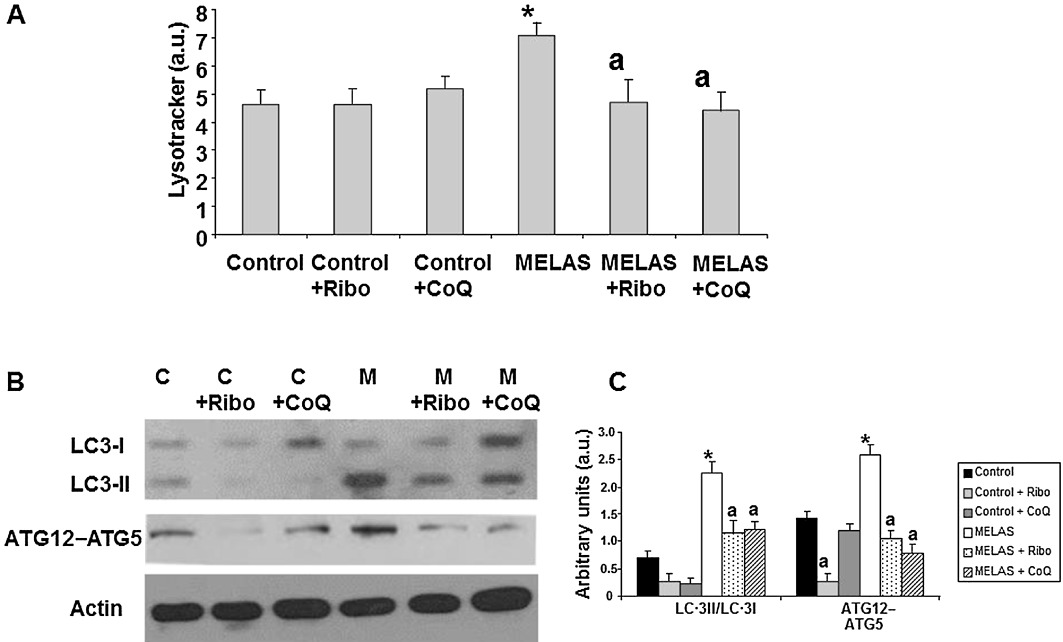
Effect of riboflavin and CoQ on autophagic markers. (A) The quantification of acidic vacuoles in control (C) and MELAS fibroblasts (M) by LysoTracker staining and flow cytometry analysis. Cells were cultured in the presence or absence of 0.06 µM riboflavin (Ribo) or 100 µM CoQ. For the control cells, the data are the mean ± SD of three separate experiments on two different control cell lines. Results are expressed in arbitrary units (a.u). (B) The protein expression levels of LC3-I (upper band) and LC3-II (lower band) and ATG12 determined in control and MELAS fibroblast cultures by Western blotting. The ATG12 band represents the Atg12–Atg5 conjugated form. Control (C) and MELAS fibroblast cultures were grown in normal culture medium or in medium supplemented with 0.06 µM riboflavin (Ribo) or 100 µM CoQ for 72 h. Actin was used as loading control. (C) Densitometry was performed using the ImageJ software. Actin was used as loading control. Data, in arbitrary units (a.u.) represent the mean ± SD of three separate experiments. *P < 0.01 between control and MELAS fibroblasts. aP < 0.01, between the presence and the absence of riboflavin or CoQ.