
Figure 6.
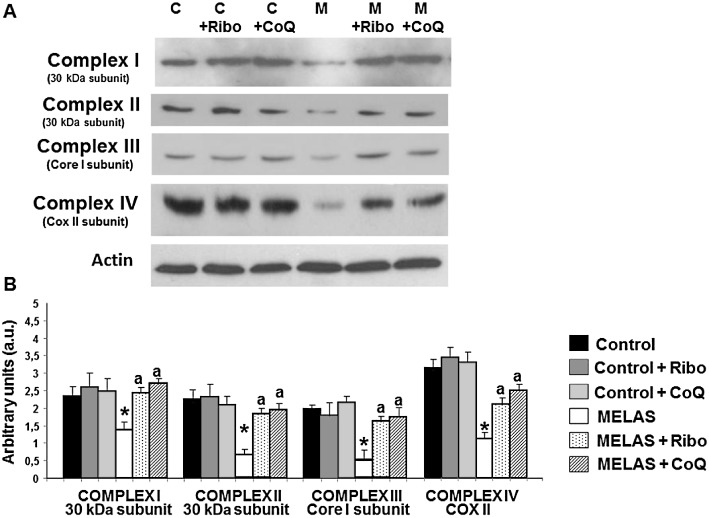
Mitochondrial protein expression levels in MELAS fibroblasts. (A) Western blot analysis of MRC proteins – complex I (30 kDa subunit), complex II (30 kDa subunit), complex III (core 1 subunit), complex IV (COX II subunit) – of control (C) and MELAS (M) fibroblasts incubated with 0.06 µM riboflavin (Ribo) or 100 µM CoQ for 72 h. Fibroblast protein extracts (50 µg) were separated on a 12.5% SDS polyacrylamide gel. Actin was used as loading control. (B) Densitometry of Western blotting was performed using ImageJ software. Data in arbitrary units (a.u.) represent the mean ± SD of three separate experiments. *P < 0.01 between control and MELAS fibroblasts. aP < 0.01, between the presence and the absence of riboflavin or CoQ.