
Figure 10.
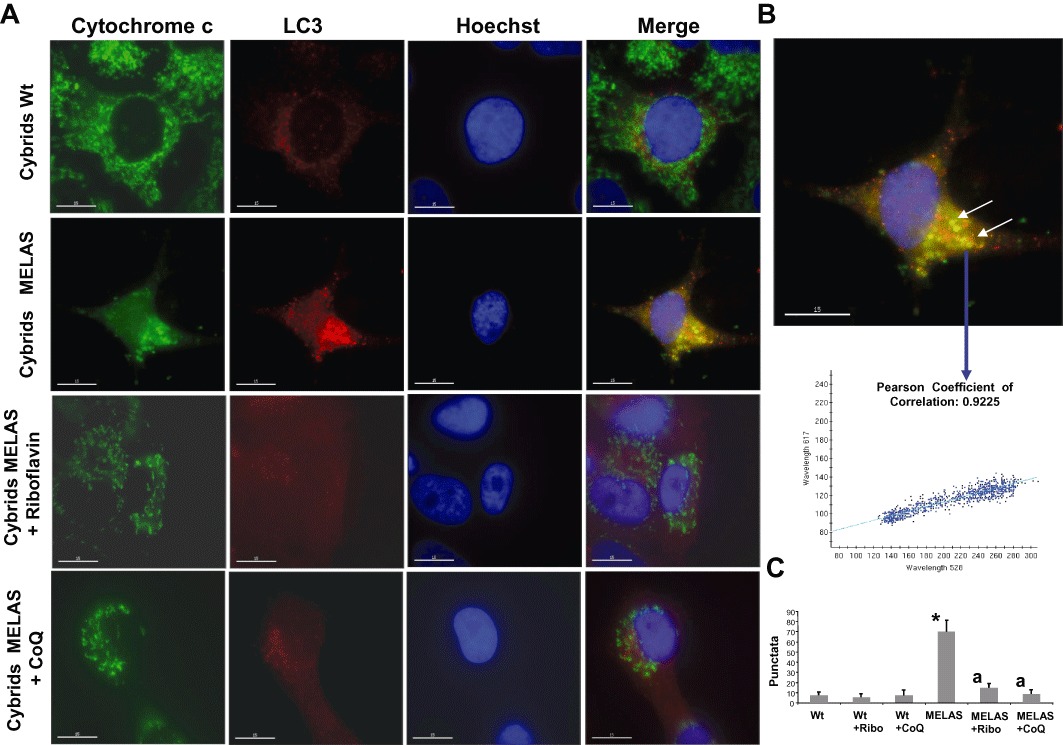
Mitochondrial degradation in MELAS cybrids. (A) Cultured Wt and MELAS cybrids were fixed, and immunostained with anti-LC3 and cytochrome c and examined by fluorescence microscopy. Colocalization of both markers was assessed by DeltaVision software. A representative picture of 100 analysed cells is shown. (B) Magnification of a small area in a MELAS cybrid. Arrows show autophagolysosomes with LC3 and cytochrome c colocalization. Colocalization of both markers was assessed using DeltaVision software calculating the Pearson coefficient of correlation. (C) Quantification of LC3 per cytochrome c puntacta in control and MELAS cybrids incubated with or without 0.06 µM riboflavin or 100 µM CoQ (n= 100 cells). *P < 0.01 between Wt and MELAS cybrids. aP < 0.01 between the presence and the absence of riboflavin or CoQ.