Figure 2.
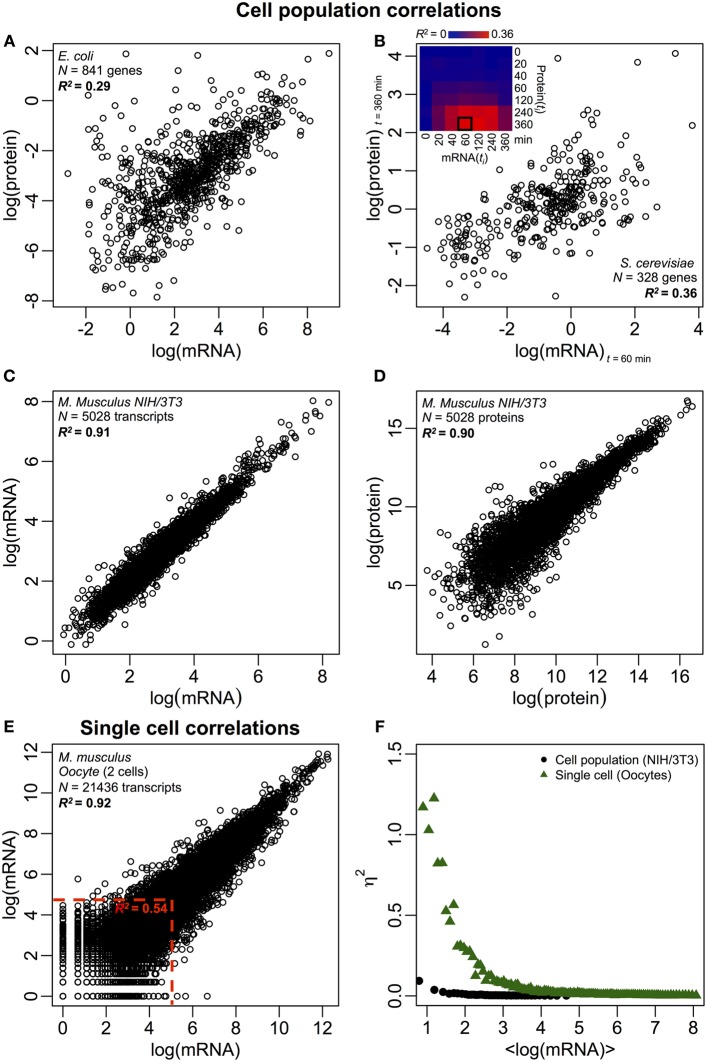
Omics-wide expression correlations. Cell populations: mRNA-protein correlations in (A) E. coli (Taniguchi et al., 2010) and (B) S. cerevisiae (Fournier et al., 2010) between mRNA expressions at t = 60 min and protein expressions at t = 360 min. Insert: correlation matrix between all time points shows a delayed increase in correlations between mRNA and proteins. (C) mRNA and (D) protein expressions between two samples of murine NIH/3T3 cells (Schwanhäusser et al., 2011). Single cells: (E) mRNA expressions between two oocytes (Tang et al., 2009). The red dotted lines indicate the regions of low mRNA expressions (log(mRNA) < 5). (F) Noise (η2) versus log(mRNA expressions) for cell population (NIH/3T3, black dots, Schwanhäusser et al., 2011) and single cells (Oocytes, green triangles, Tang et al., 2009). Each dot represents the value for a group of P = 100 mRNAs. η2 is near zero for the cell population for all mRNA expressions. For single cells, η2 is highest for mRNAs with the lowest copy numbers, and approaches zero for higher copy numbers.

