Figure 8.
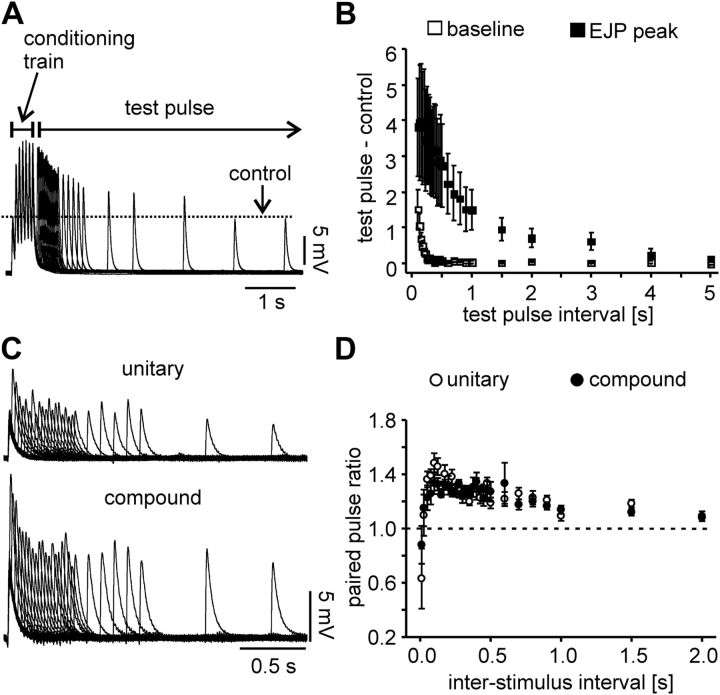
A, Overlaid compound EJP recordings from a stimulation protocol with a conditioning train and single test pulses at varying intervals, showing the synaptic enhancement and the time course of recovery. The dashed line indicates the EJP amplitude in response to the first pulse in the conditioning train. B, Plot of the mean response difference (n = 5) between test pulse and first pulse in the conditioning train for EJP peak voltages and preceding baseline voltages, as a function of test pulse interval. Note that summation ceases after a few hundred microseconds as the baseline voltage in between pulses returns to normal, while the increase of EJP amplitude persists for several seconds. C, Overlaid EJP recordings from paired-pulse stimulations with varying intervals (10 ms–2 s). Unitary and compound EJP recordings are from the same experiment. D, Mean paired-pulse response amplitude ratios as a function of interstimulus intervals (n = 5). Both unitary and compound responses show similar paired-pulse ratios at all interstimulus intervals.

