
Fig. 2.
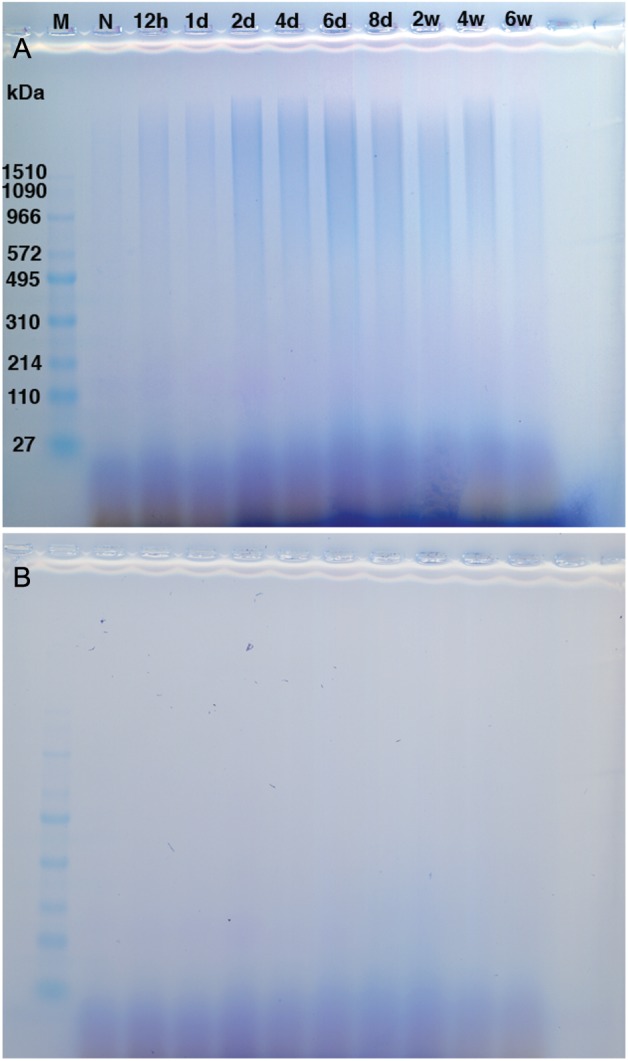
HA sizing distribution from lungs isolated during acute and chronic antigen exposure. (A) HA samples not treated with Streptomyces hyaluronidase. (B) HA samples treated with Streptomyces hyaluronidase. M indicates marker. N represents naïve mice. Data are shown from four pooled samples for the following time points, 12 h (12 h), 1 day (1d), 2 days (2d), 4 days (4d), 6 days (6d), 8 days (8d), 2 weeks (2w), 4 weeks (4w), and 6 weeks (6w).