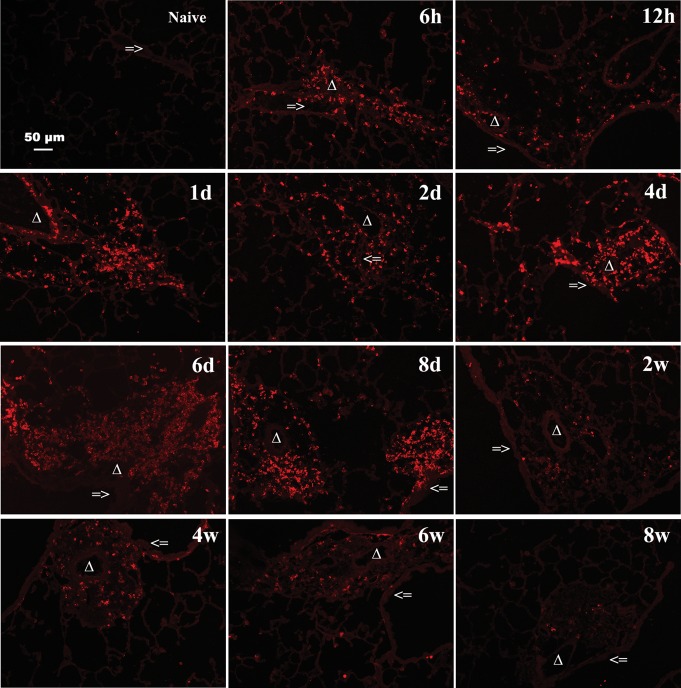
Fig. 7.
Eosinophils distribution in lung tissue during acute and chronic antigen exposure. Lung sections from naïve and challenged mice were stained with anti-EMBP [red (full colour versions of figures are available online)], which demonstrates the distribution and increase in eosinophils during the acute phase, 6 h through 8 days, and resolution during the chronic phase, 2–8 weeks. Representative lung sections are shown.

