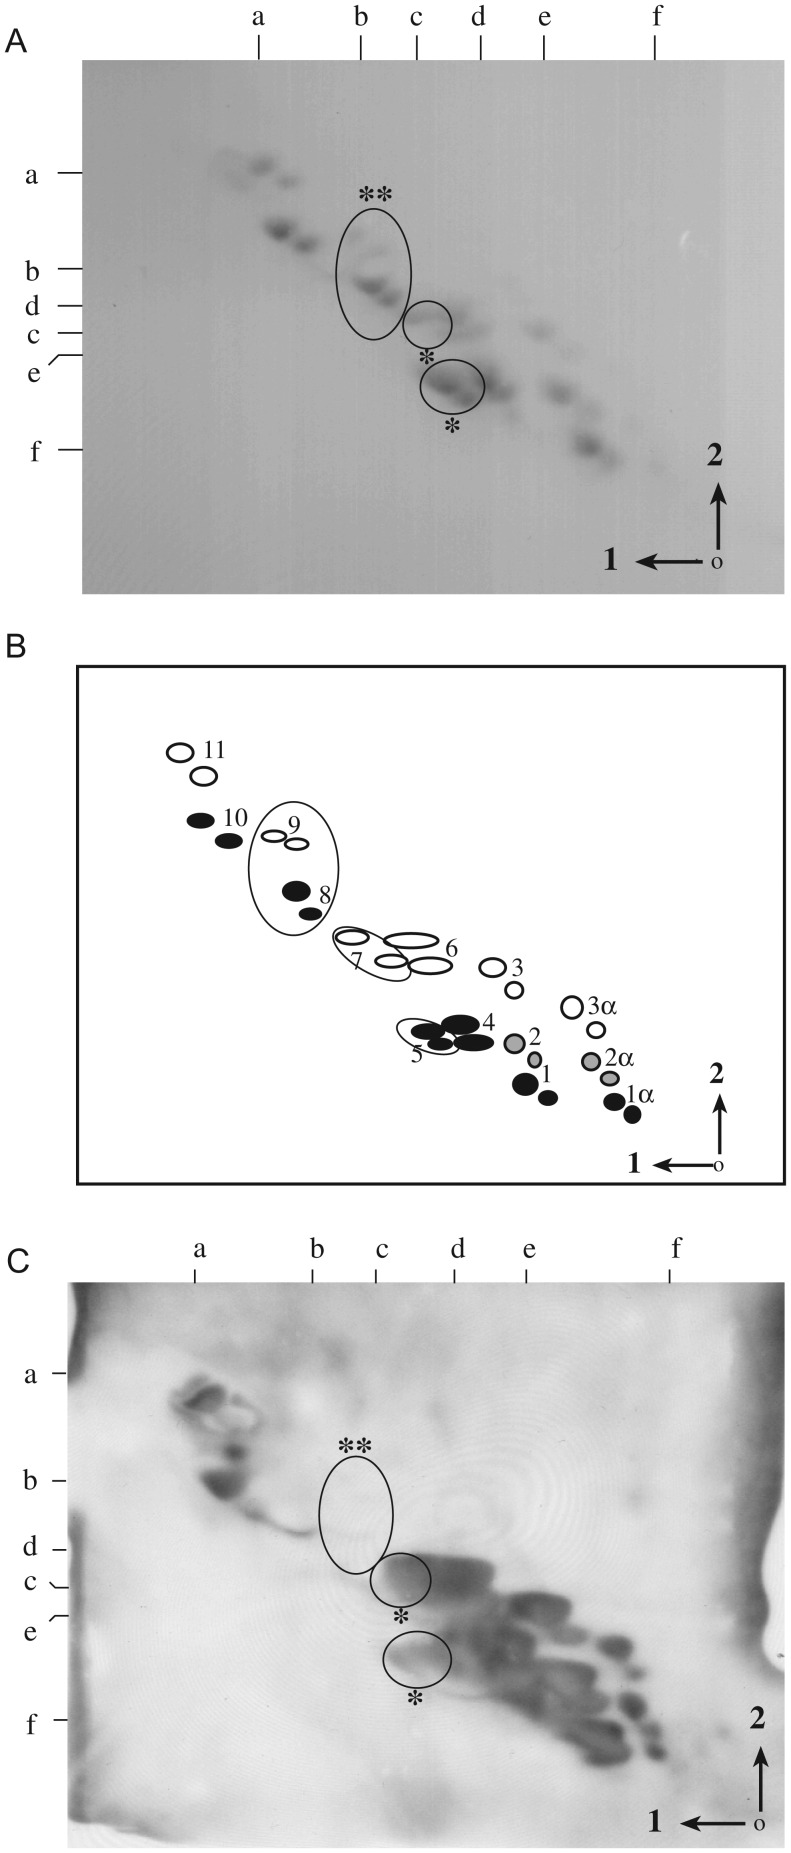
Fig. 2.
Affinity overlay of LT-IIc binding to thioglycollate-elicited murine peritoneal macrophage gangliosides. Affinity overlay immunoblots were made from TLC plates of murine peritoneal macrophage gangliosides, run in two dimensions and overlaid with LT-IIc. The full complement of murine peritoneal macrophage gangliosides on two-dimensional TLC is shown (A) with a schematic diagram denoting their structures (B). Affinity overlay immunoblot of LT-IIc binding is shown in (C). Black ellipses of schematic diagram (B) indicate NeuGc-containing gangliosides; clear ellipses indicate NeuAc-containing gangliosides; gray ellipses indicate mixed NeuAc/NeuGc-containing gangliosides. Numbers in the schematic diagram (B) correspond to structures: 1α, GD1α-NeuGc; 2α, GD1α-NeuAc/NeuGc; 3α, GD1α-NeuAc; 1, GD1a-NeuGc; 2, GDla-NeuAc/NeuGc; 3, GD1a-NeuAc; 4, GM1b-NeuGc; 5, GM1a-NeuGc; 6, GM1b-NeuAc; 7, GM1a-NeuAc; 8, GM2-NeuGc; 9, GM2-NeuAc; 10, GM3-NeuGc; 11, GM3-NeuAc. Three large ellipses outline peaks 5 and 7 (GM1a, asterisk) and peaks 8 and 9 (GM2, double-asterisk) on the schematic diagram and correspond to positions of identical large ellipses on the thin-layer chromatogram (A) and autoradiograph (C). Arrows and numbers in the right lower corner indicate the directions of first and second solvent runs. The origin is denoted by a dot in the lower right corner. Ganglioside standards, run in each dimension, are noted along the top (Solvent 1) and left (Solvent 2) margins of each panel and are as specified in Figure 1 (B). The schematic (B) was reproduced from Yohe et al. (1997), by permission of Oxford University Press.

