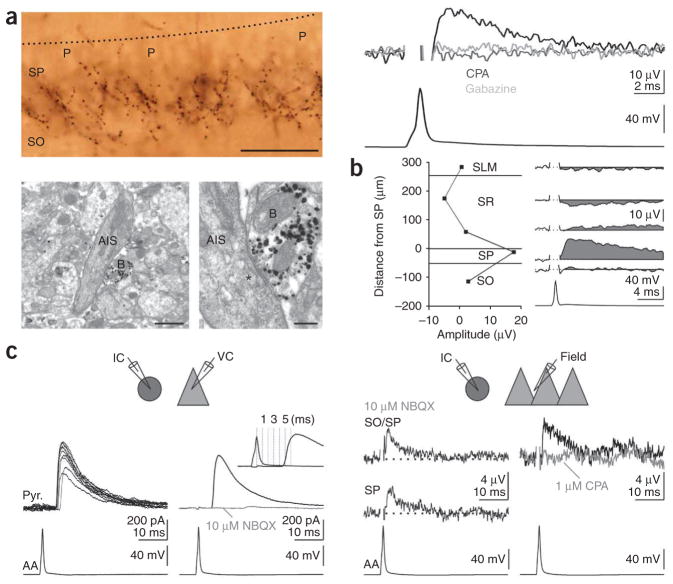
Figure 3.
Axo-axonic cells are hyperpolarizing. (a) Top left, light micrograph of a biocytin-filled axo-axonic cell. Note the radial bouton cartridges under the pyramidal cells (P). The dotted black line represents the border between stratum radiatum and stratum pyramidale. Bottom, electron micrographs of a bouton (B) of the axo-axonic cell shown above (gold/silver visualization) made onto the electron-opaque axon initial segment (AIS) and its synaptic junction (asterisk) at high magnification. Scale bars represent 50 μm (top), 1 μm (bottom left) and 0.25 μm (bottom right). Top right, uField (black, recorded at the border between stratum pyramidale and stratum oriens) from the axo-axonic cell on the left in control conditions (black trace) or treated with CPA (light gray) or gabazine (dark gray). (b) The uField from a different axo-axonic cell recorded in multiple layers (right). (c) Top left, schematic of recording configuration. IC, current clamp; VC, voltage clamp. Bottom left, an action potential in an axo-axonic cell (bottom left) evoked an IPSC in a voltage-clamped pyramidal cell (top left, black traces, ten consecutive sweeps; top right, averaged black trace, Vm = 0 mV; cesium internal) that was blocked by the glutamatergic antagonist NBQX (10 μM, top right, gray trace). Inset, overlay of action potential and IPSC to illustrate the long latency (~5 ms). Top right, schematic of recording configuration. Bottom right, an action potential in the axo-axonic cell (bottom left) evoked a positive uField at the border of stratum oriens and stratum pyramidale (top) and in stratum pyramidale (middle) in the presence of NBQX. Bottom right, the uField in control conditions (top right, black trace) and treated with CPA (light gray trace).

