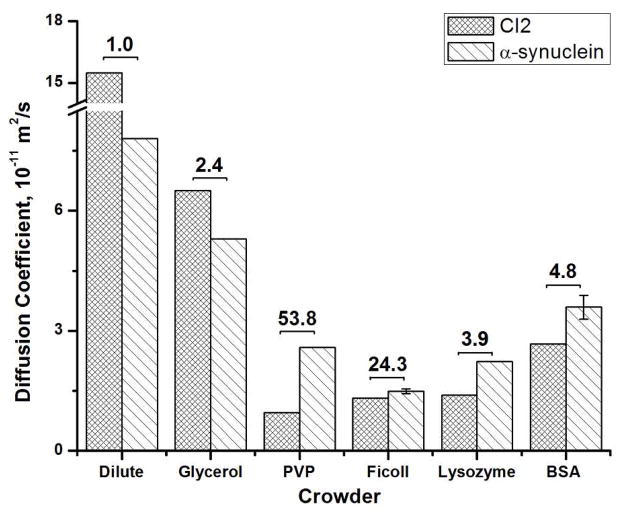
Figure 3.
Histogram showing the translational diffusion coefficients of CI2 and α-synuclein in dilute solution and 300 g/L solutions of glycerol, PVP, Ficoll 70, lysozyme and bovine serum albumin at 25 °C. Error bars represent the standard deviation of the mean from three trials. The corresponding macroviscosity (in cP) is indicated at the top of each entry. The CI2 data have been published.19,20

