
Fig. 3.
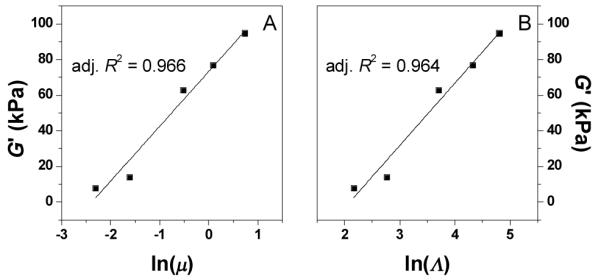
The elastic modulus G| vs. the logarithm of ionic strength (A) and logarithm of conductivity (B). μ is in M and Λ is in mS·cm−1. The solid line represents linear fitting, and the goodness of fitting (adjusted R2) is labeled. The slope and intercept of linear fitting in panel A is 30.76 kPa and 73.20 kPa, respectively; the slope and intercept of linear fitting in panel B is 35.04 kPa and −73.55 kPa, respectively.