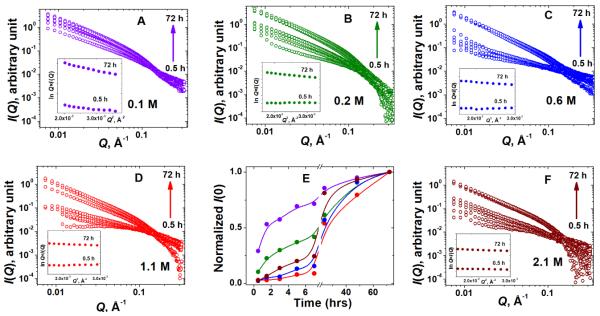
Fig. 4.
(A, B, C, D, F) SAXS scattering profiles I(Q) vs. Q of Gel 1 – Gel-5 over time. Insets in all plots show the changes in the corresponding Guinier plots for rod-like particles, lnQ×I(Q) vs. Q2, at the start (0.5 hr) and at the end (72 hr) of the monitoring period. (E) Time dependence of the zero-angle scattering intensities I(0) from Guinier analysis of lnI(Q) vs Q2 plots for the five hydrogels. To facilitate comparison, I(0) in each case was normalized by their maximum value (I(0) at 72 hrs); so all curves converge to 1. The lines represent a basic B-spline fit of the data. Violet: Gel-1 (A); green: Gel-2 (B); blue: Gel-3 (C); red: Gel-4 (D); brown: Gel-5 (F).

