
Fig. 5.
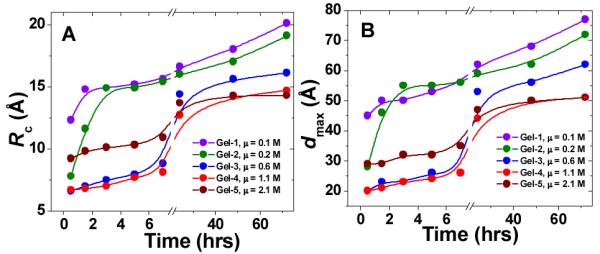
Time-evolution of the cross-sectional parameters of the hydrogel fibers formed at different ionic strengths: (A) radius of gyration of the cross-section, Rc; (B) maximum cross-section dimension, dmax. The lines represent a basic B-spline fit of the data. Violet: Gel-1; green: Gel-2; blue: Gel-3; red: Gel-4; brown: Gel-5.