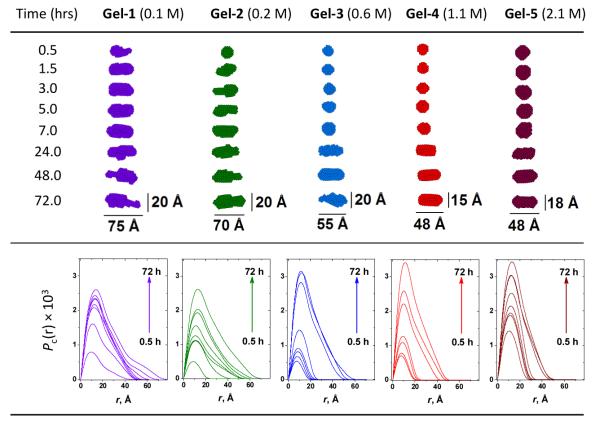
Fig. 6.
SAXS monitoring of the ionic strength effects on the gelation process. Top panel shows the time evolution of the 2D average cross-section of the peptide fibers. Bottom panel show the changes in the corresponding pair-wise distance distribution function of the cross-section, Pc(r). Violet: Gel-1; green: Gel-2; blue: Gel-3; red: Gel-4; wine: Gel-5. Pc(r) functions in each case were normalized by their maximum zero-angle scattering intensity of cross-section, Ic(0).

