
Fig. 8.
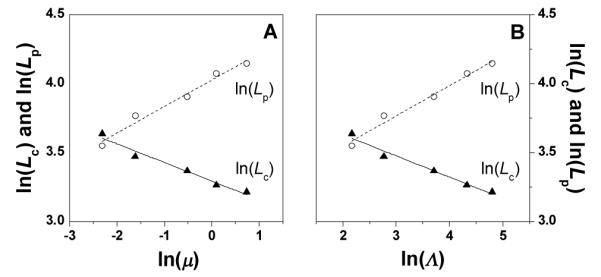
ln(Lc) and ln(Lp) vs. ln(μ) (A) and ln(Λ) (B), the solid and dash line is the linear fitting results. In panel A, the adjusted R2 of ln(Lc) vs. ln(μ) is 0.962, the intercept is 3.291, and the slope is −0.135; the adjusted R2 of ln(Lp) vs. ln(μ) is 0.970, the intercept is 4.024, and the slope is 0.192. In panel B, the adjusted R2 of ln(Lc) vs. ln(Λ) is 0.965, intercept is 3.937, and the slope is −0.154; the adjusted R2 of ln(Lp) vs. ln(Λ) is 0.975, the intercept is 3.105, and the slope is 0.220.