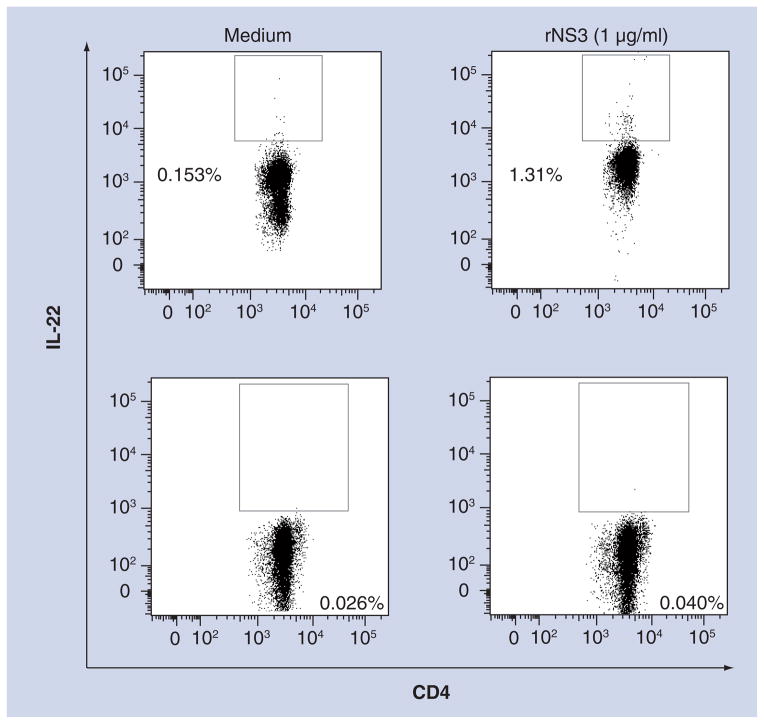
Figure 4. CD4+ T cells express IL-22 in resolved HCV subjects.
Representative flow cytometric dot plots of CD4+ IL-22+ expression. Data are representative of three different experiments. Top panels are dot plots of peripheral blood mononuclear cells from a resolved HCV subject. Bottom panels are dot plots of peripheral blood mononuclear cells from a chronic HCV subject. Gating was determined by both medium samples (left panels) and fluorescence minus one including the isotype control (data not shown).
rNS3: Recombinant NS3.

