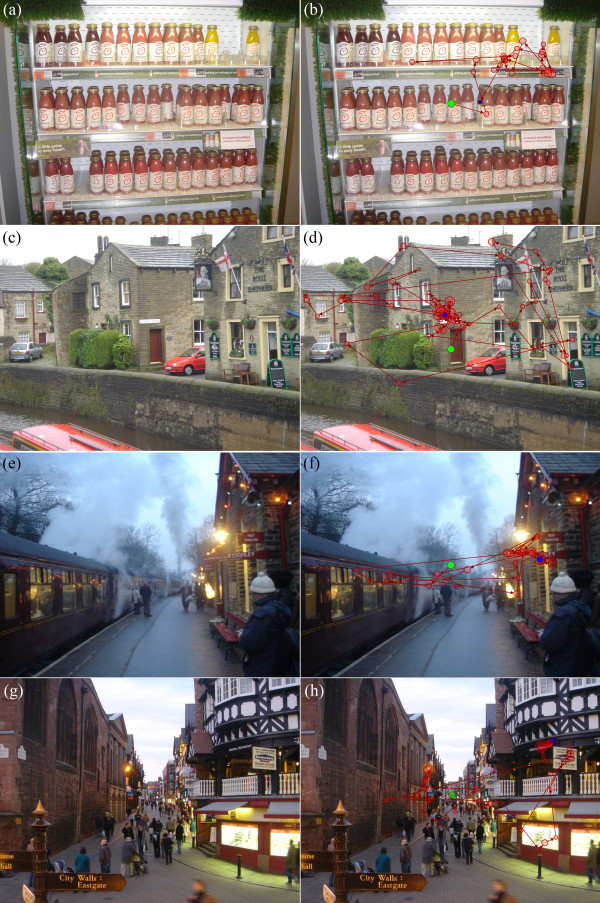
Figure 1.
Four different images from the study. In image (a) participants were asked to find the price of the yellow smoothie drink. The task in image (c) was to find the name of the street. In image (e) participants were asked to find the place name for the destination of the train and in the final image (g) participants were asked to find the sign for the ‘Oriental Restaurant’. The same images are shown in (b), (d), (f) and (h) with superimposed scanpaths for four different patients. The green and blue symbols indicate the starting and final fixation respectively. The red circles represent fixations and connecting lines are saccades (circles increase in size with fixation duration).

