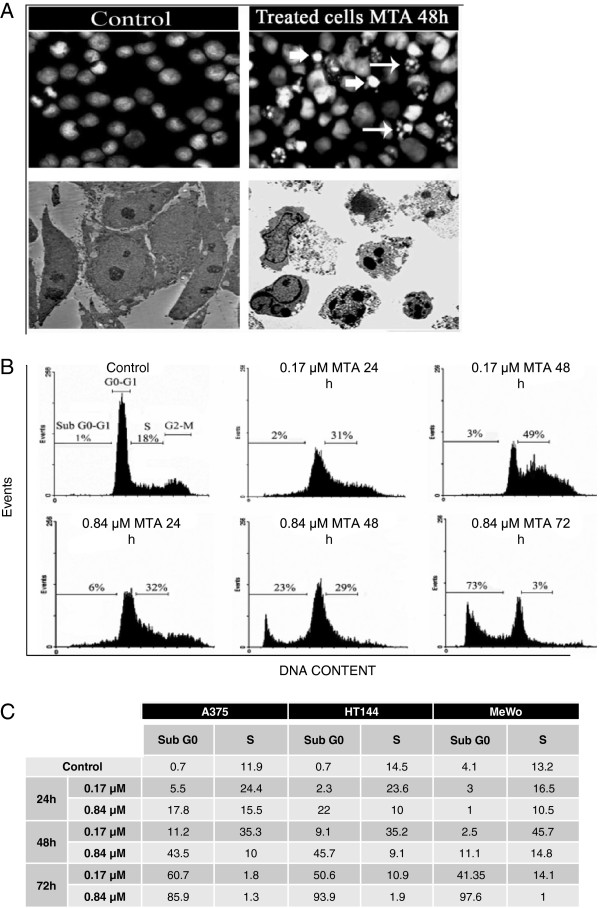
Figure 2.
MTA induced apoptosis in human melanoma cell lines (A) The nature of cell death was identified by studying morphological changes which were apparent via immunocytochemistry and electron microscopy. Top: A375 representative fluorescence microscopy of nuclei stained with PI before and after MTA exposure. All fields were photographed at a magnification of 40 X. Bottom: A375 representative TEM images of cells before and after MTA exposure. Both techniques reveal that MTA exposure induced morphological changes such as DNA fragmentation and marginalization (arrows), which are characteristic of apoptosis. (B, C) Quantification of the extent of apoptosis was carried out by cell cycle analysis. Cells lines were treated with two different concentrations of MTA for 24, 48 and 72 h and analysed by flow cytometry. The results illustrated in (B) for Hs294T line are representative and the results for all cell lines are summarized in the table (C). Results are expressed as a percentage of the cell population in the subGo-G1 and S phases of three independent measurements. Cultures treated with MTA showed a time- and dose-dependent increase in their percentage of hypodiploid cells, with a modification of cell percentages in the S-phase of the cell cycle.

