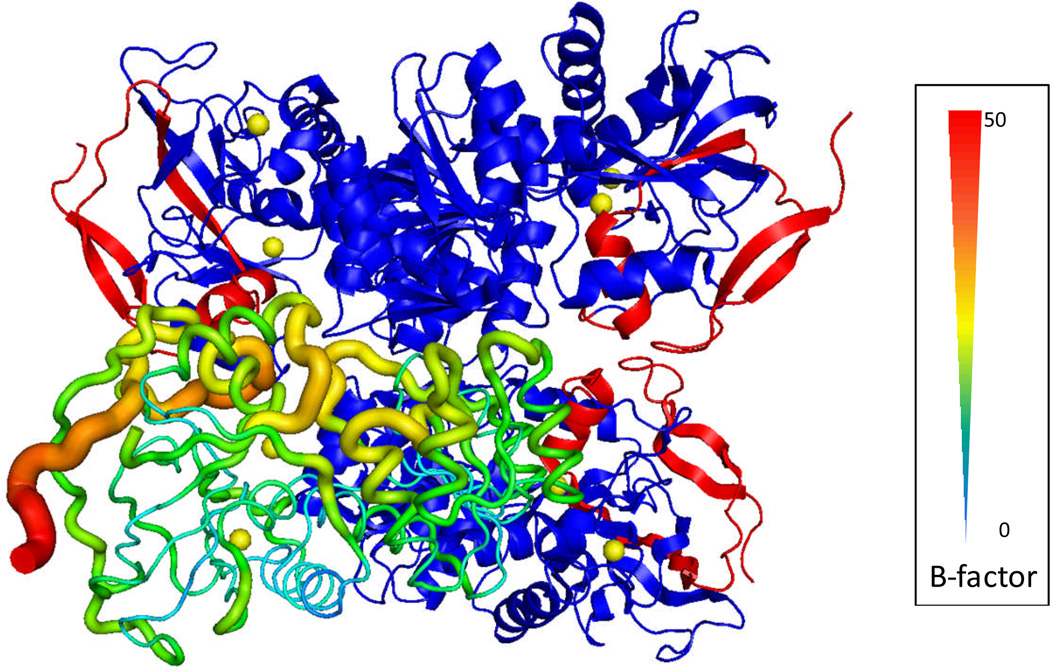
Figure 4.
Crystal structure of yeast ADH tetramer (PDB code 2HCY). The lower left subunit is shown in B-factor scale where the N-terminus has the highest B-factor value. In each of the other three subunits, the sequenced N-terminal region up to the 55th residue by ECD is highlighted in red – ref 137.

