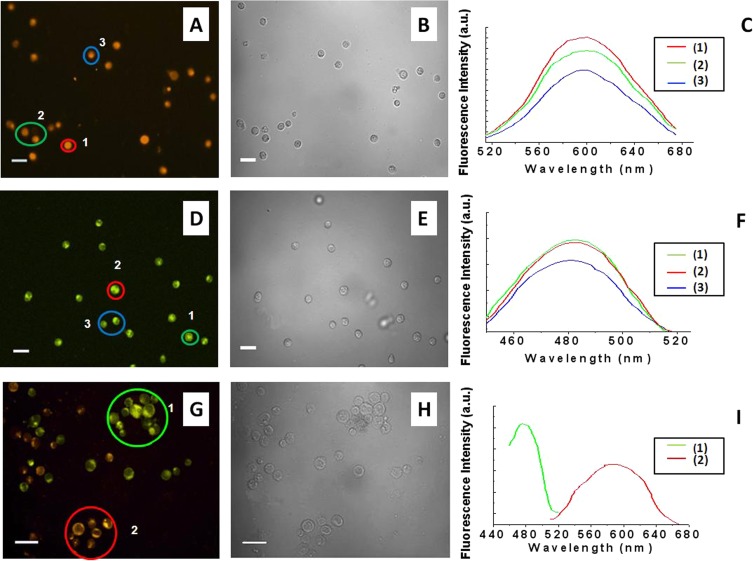
Figure 2.
Confocal microscopy images of (a) SUP-T1 T cells, (d) TK6 B cells, and (g) SUP-T1 T and TK6 B cells after the incubation onto loaded smart platforms with the two labeled MAbs. The double cell staining was shown in the latter experiment. It was observed that TF1-antiCD4 antibody positively stained SUP-T1 cells whereas TF2-antiCD19 positively stained TK6 cells. The corresponding images (b), (e), (h) were acquired under bright field exposure. For the sake of clarity, only selected cells are shown. CD4-positive cells are false-colored orange and CD19-positive cells are false-colored green. The scale bar was 25 μm.

