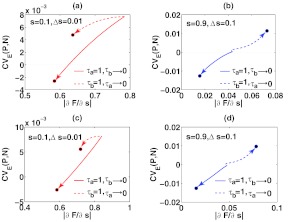
Figure 9.
The changes of CVE and as the negative or fast feedback loop is adjusted from fast to slow. The arrows indicate where CVE(P, N) and head as τa or τb approaches zero, and the black solid circles are their limits. Here c1 = 2/min, c2 = 1/min, b1 = 2/min, b2 = 1/min, a1 = 3/min, and a2 = 1/min. In panel (a)-(b), ka = 1 and kb = 1; in panel (c)-(d), ka = 1 and kb = 5.

