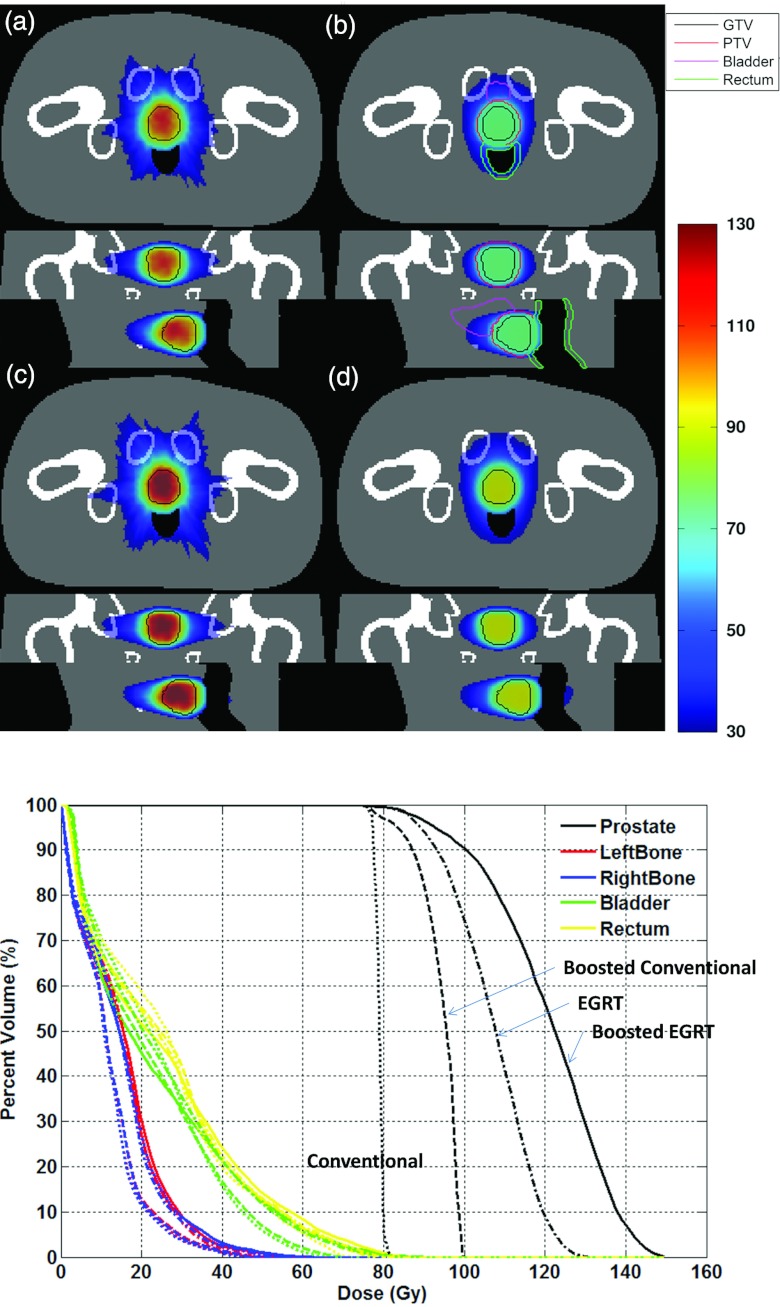
Figure 9.
The dose distributions for (a) original EGRT (dashed-dotted lines), (b) conventional method (dotted lines), (c) boosted EGRT (solid lines), and (d) boosted conventional method (dashed lines) with the associated DVH. The GTV is contoured with a solid line in all scenarios. Contoured PTV, bladder, and rectum are shown only in (b) for simplicity. The boost region is equivalent to the GTV in this case (without a setup error). Note that the curves on OAR's are mostly overlapping with each other.

