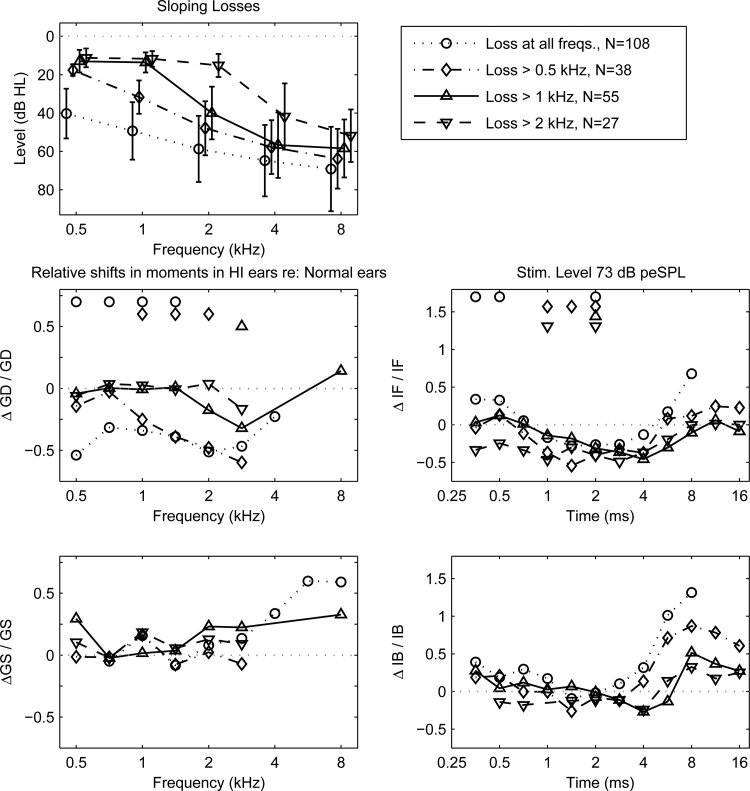
Figure 14.
CEOAE moments at 73 dB peSPL in sloping SNHL re: normal group. Left column with frequency abscissa—Top: Audiometric HL for sloping-loss groups. Middle: in GD for SNHL re: normal groups. Significant changes () indicated by marker above frequency (top of panel). Similar plotting style used in remaining panels. Bottom: Right column with time abscissa—Middle: Bottom:

