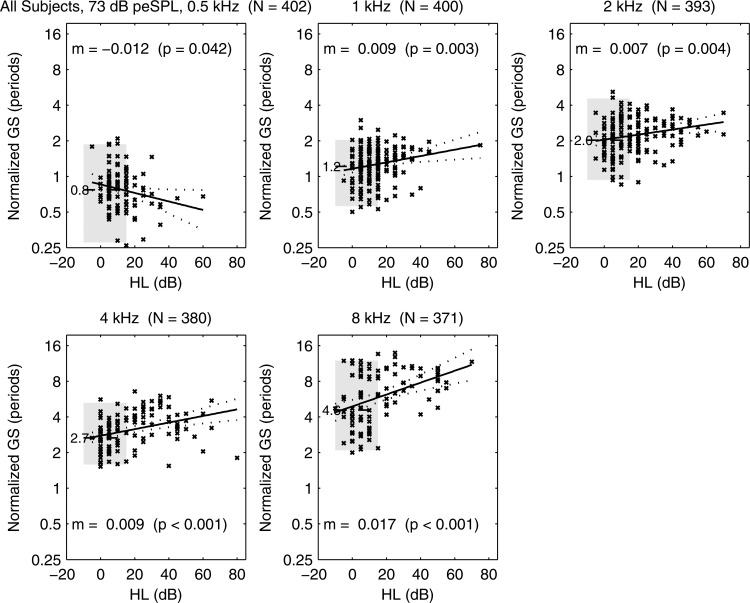
Figure 17.
At 73 dB peSPL, normal-group median GS plotted (horizontal dashed line) with median listed to left of line (e.g., 0.8 periods at 0.5 kHz), and IQR plotted (gray shading). Scatter plot of SNHL ears shows GS vs HL with × marker. Regression model for SNHL ears (solid line) with 95% CI (dotted lines). Text lists regression slope m (i.e., ) and

