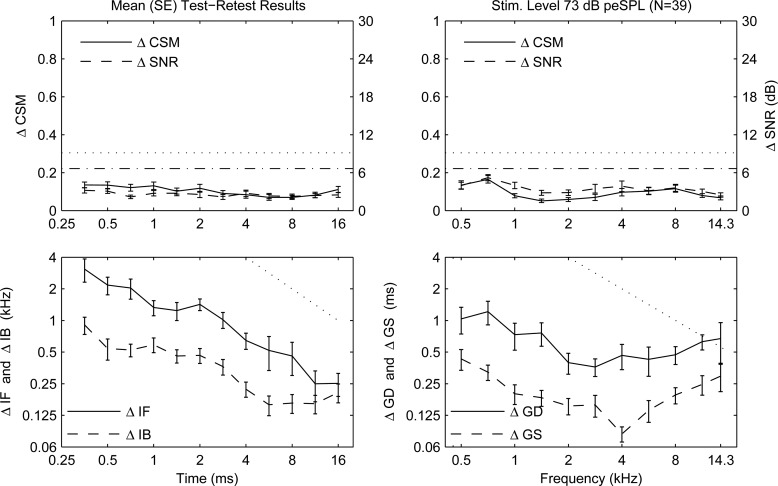
Figure 7.
Magnitude difference (mean SE) in subset of normal ears () between tests 1 and 2 for CSM and SNR, and CEOAE moments. Left column, time abscissa—Row 1: (solid line) and (dotted line) [left ordinate], and (dashed line) and (dashed-dotted line) [right ordinate]. Row 2: and . Dotted line slope of −1. Right column, frequency abscissa—Row 1: CSM (solid line) and (dotted line) [left ordinate], and SNR (dashed line) and (dashed-dotted line) [right ordinate]. Row 2: and . Dotted line slope of −1.

