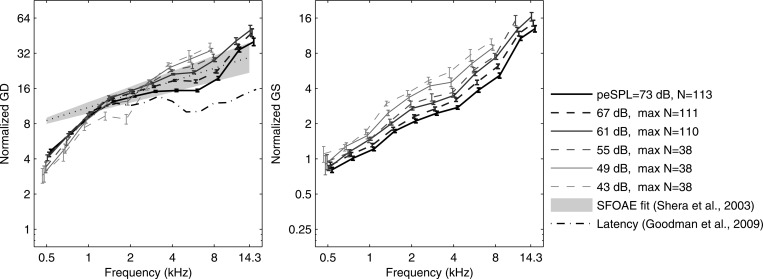
Figure 8.
Normalized GD and GS (mean SE) as ratios of GD and GS, respectively, to sample period (units, # periods) over stimulus peSPL range 43–73 dB. Left: Normalized GD from CEOAEs. Fit line of normalized GD for SFOAEs (dotted line) with 90th percentiles of fit (gray shading) (Shera et al., 2010). CEOAE latency at 73 dB peSPL (Goodman et al., 2009). Right: Normalized GS from CEOAEs. (Data displaced horizontally for clarity.)

