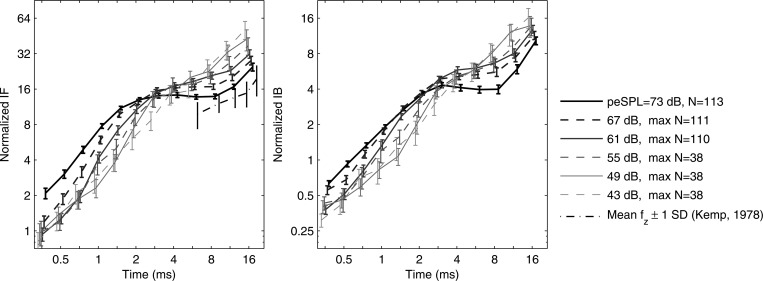
Figure 9.
Normalized IF and IB (mean SE) as products of IF and IB, respectively, and sample period (units, # cycles) over stimulus peSPL range 43–73 dB. Left: normalized IF from CEOAEs. Mean standard deviation of normalized zero-crossing rate (Kemp, 1978). Right: normalized IB from CEOAEs. (Data displaced horizontally for clarity.)

