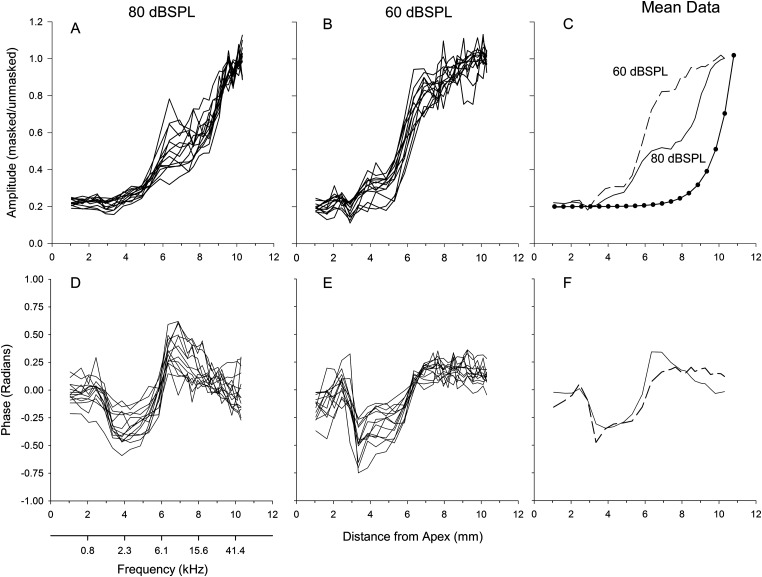
Figure 3.
Cumulative amplitude functions (CAFs), defined as the noise-suppressed response relative to the unsuppressed response, for the 80 and 60 dB SPL conditions from all animals, along with the mean CAFs. The curve with filled symbols is an exponential function with a space constant of 1 mm (panel C). Bottom panels are the phase of the CM normalized by subtracting the individual mean from each waveform for all animals. The corresponding mean phase for 80 and 60 dB SPL are shown in the bottom right panel.

