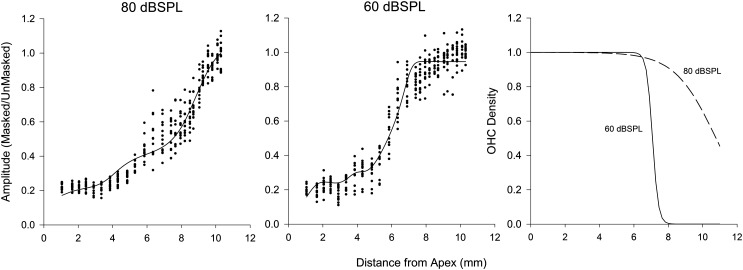
Figure 5.
Left and middle panels illustrate the CAFs (dots) from the 80 and 60 dB SPL conditions. The lines represent the estimated model fits showing growth similar to the animal data. The right panel is the solution to the logistic function estimating the percentage of OHCs contributing to the CAF for the 80 dB SPL (dashed line) and 60 dB SPL (solid line) conditions.

