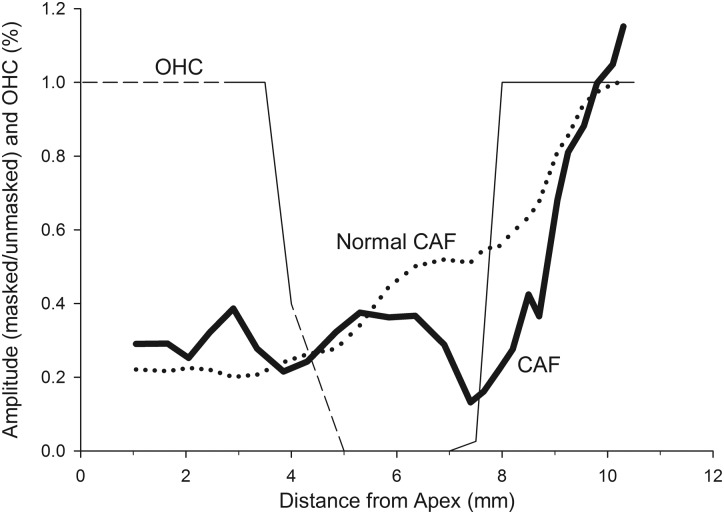
Figure 6.
The solid thin line is the percentage of OHC present along the length of the cochlea. The dashed line indicates regions wherein OHCs were uncountable due to error/artifacts of the histologic preparation. The CAF from this animal (solid thick line) is abnormal through the cochlear region with missing OHCs, then the curve increases over the region where OHCs are present in the base. The dotted line is the average CAF computed across all of the animals.

