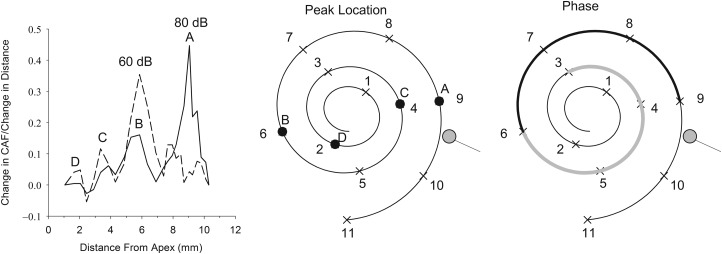
Figure 7.
Left panel is the derivative of the mean CAF with respect to distance for the 80 dB SPL (solid line) and 60 dB SPL conditions (dashed lines). The middle panel illustrates a two-dimensional view of the cochlear spiral with locations of the peaks for the 80 dB SPL condition from the differentiated CAF indicated by letters A–D. The right panel is the same two-dimensional cochlear view with the location where the phase is negative (light grey line) or positive (dark line) relative to the no-noise condition.

