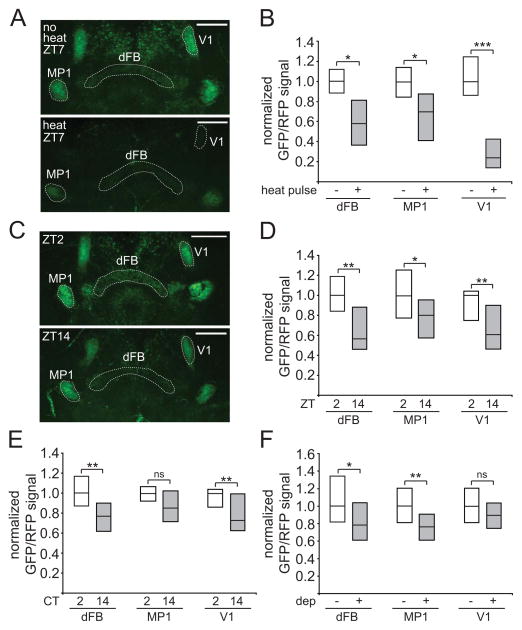
Figure 5. Imaging experiments using ANF-GFP suggest the PPL1-dFB neurons are more active during the day and during wakefulness.
(A) Whole-mount brains from flies expressing ANF-GFP, myr-RFP, and dTrpA1, under control of TH-D4-Gal4. Images consist of maximum projections of a 12 μm section through the middle of the brain to highlight the mushroom body and central complex projections, with either no heat pulse (“no heat”) or 5 hr 32°C heat pulse (“heat”) from ZT2–ZT7. “dFB”, “MP1”, and “V1” indicate projections to the dorsal fan-shaped body or MP1 and V1 regions of the mushroom bodies, respectively. Dashed lines highlight these projections. (B) GFP/RFP signal for these flies is represented as simplified box plots, where the line inside the box indicates the median, and the top and bottom represent 75th and 25th percentiles, respectively. n=7 for no heat pulse and n=12 for heat pulse conditions. (C) Whole-mount brains from flies expressing ANF-GFP and myr-RFP under control of TH-D4-Gal4 at ZT2 or ZT14. GFP/RFP signal is shown as simplified box plots at ZT2 (n=20) and ZT14 (n=21) (D), CT2 (n=15) and CT14 (n=20) (E), or no sleep deprivation (no dep, n=22) and sleep deprivation from ZT12–24 (dep, n=31) (F) conditions. Scale bar denotes 50 μm.

