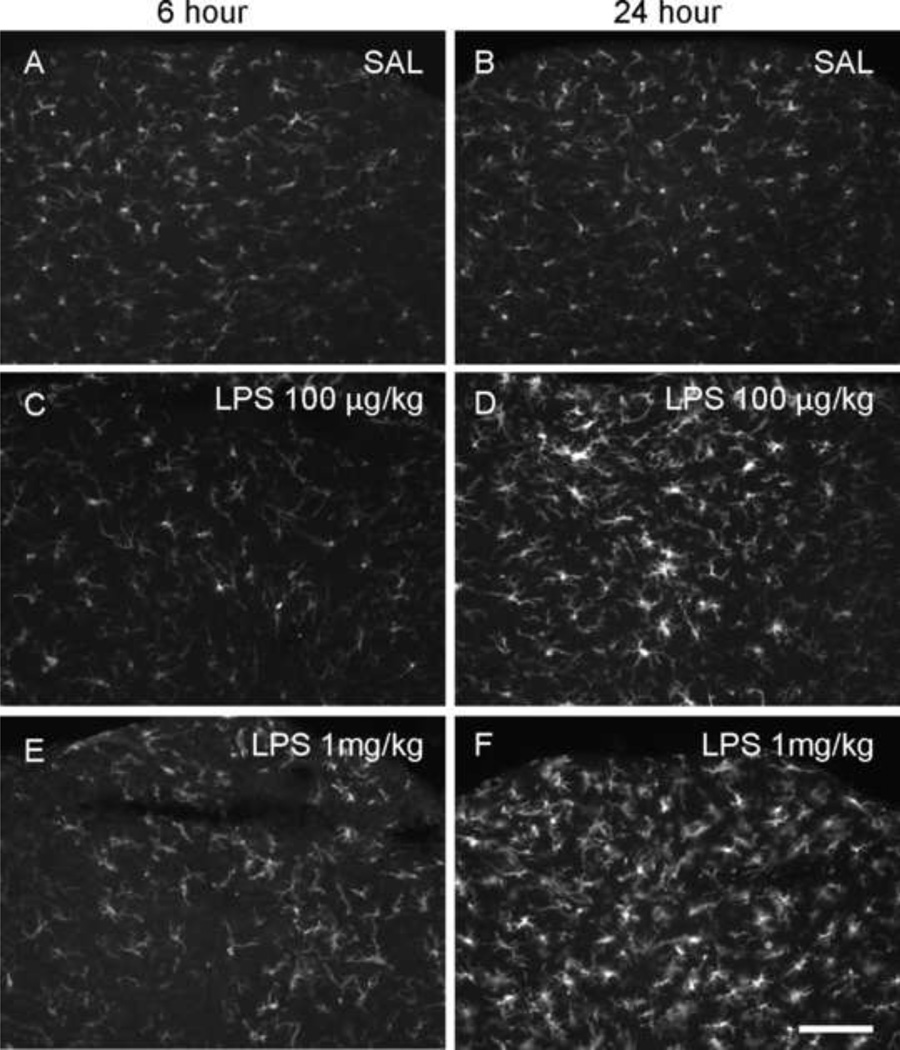
Figure 1.
Iba-1 immunoreactive microglial cells in area postrema. CD1 Mice were treated with an intraperitoneal injection of saline (SAL; A, B), 100 µg/kg lipopolysaccharide (LPS; C, D) or 1 mg/kg (E, F) LPS and were sacrificed 6 or 24 h after injection. In 100 µg/kg group, the activated microglial cells were found at 24 h after treatment (D). But in 1 mg/kg group, the change of morphology started at 6 h (E) and it was more prominent 24 h after treatment (F). Scale bar: 100 µm.

