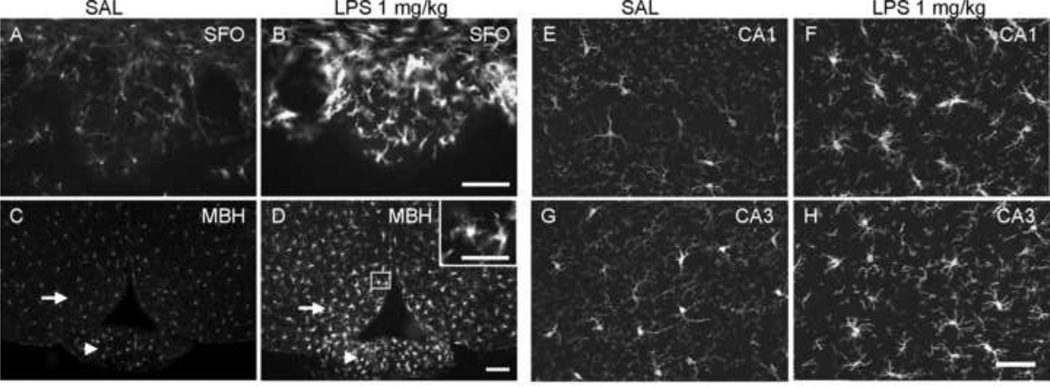
Figure 2.
Iba-1 immunoreactive microglial cells in different brain regions 24 h after saline (SAL) or LPS treatment (1 mg/kg, i.p.). Activated microglial cells were found in CVOs (A, B, subfornical organ [SFO]; C, D, median eminence [arrow heads]) in LPS treated mice. Other brain regions also had microglial cells sporadically showing enlarged perikarya and thick processes with multiple branches (illustrated as the insert in panel D), such as arcuate hypothalamic nucleus (C and D; arrows) and hippocampus (E & F, CA1; G & H, CA3). (MBH, medial basal hypothalamus). Scale bar: 100 µm, insert in panel D: 50 µm.

