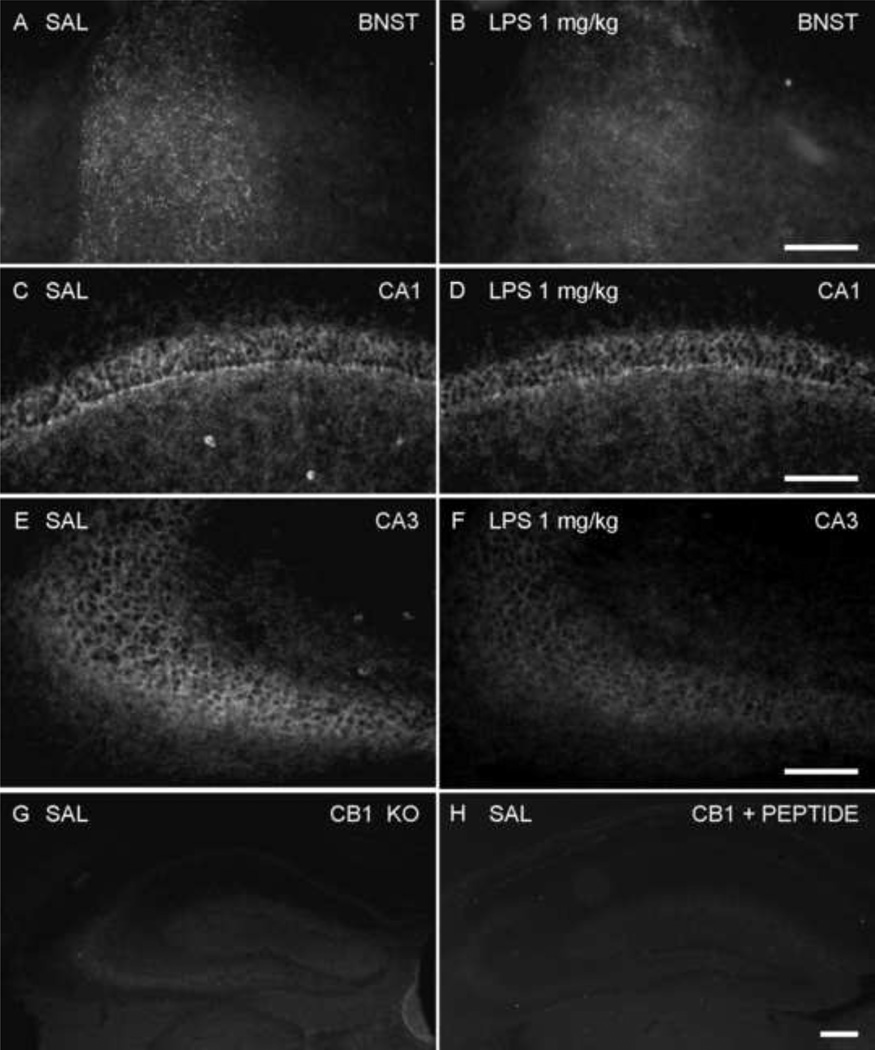
Figure 6.
Fluorescence micrographs of N-terminal CB1 immunoreactivity in the brain 24 h after saline or LPS treatment (1 mg/kg, i.p.). Twenty four hours after saline or LPS treatment, CB1 expression decreased in the dorsal part of BNST (A, B), the CA1 (C, D) and CA3 (E, F) regions of the hippocampus in LPS-treated mice. (G) N-terminal CB1 immunoreactivity in the hippocampus of a CB1 knockout mouse. (H) N-terminal CB1 immunoreactivity in hippocampus of CD1 mouse was absent when the antibody was preabsorbed with 10 µg/ml of the immunizing peptide. Scale bar: 100 µm.

