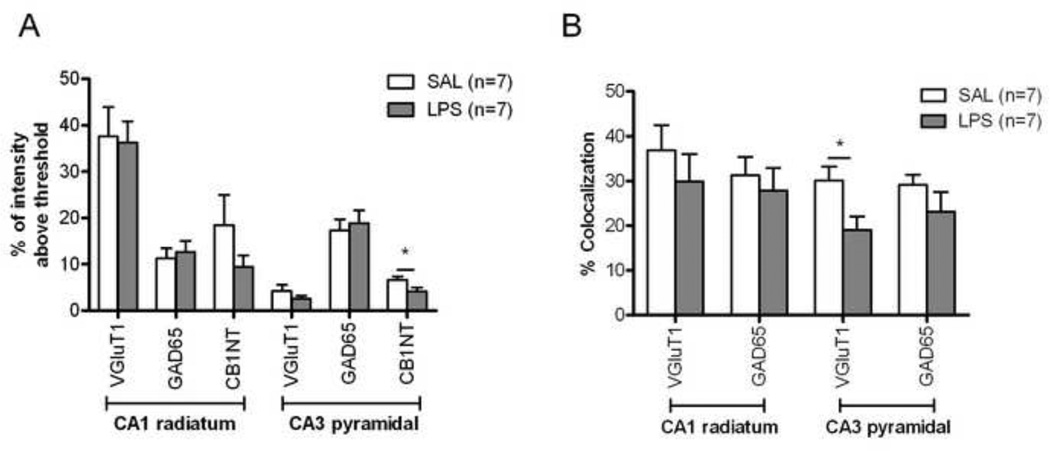
Figure 8.
Quantitative assessment of the distribution of CB1 in different nerve terminal populations in the hippocampus. Twenty four hours after treatment with saline or LPS (1 mg/kg, i.p.), N-terminal CB1, VGluT1 and anti-GAD65 immunoreactivity were evaluated from confocal images. (A) In CA1, the immunoreactivity of these three antibodies was similar in treated and control animals. However, in CA3, CB1 immunoreactivity was significantly reduced in LPS-treated animals. (B) Analysis of the colocalization of the different antibodies indicated that the major changes of CB1 distribution in CA3 region were found on glutamatergic nerve terminals rather than on GABAergic terminal. *p<0.05.

