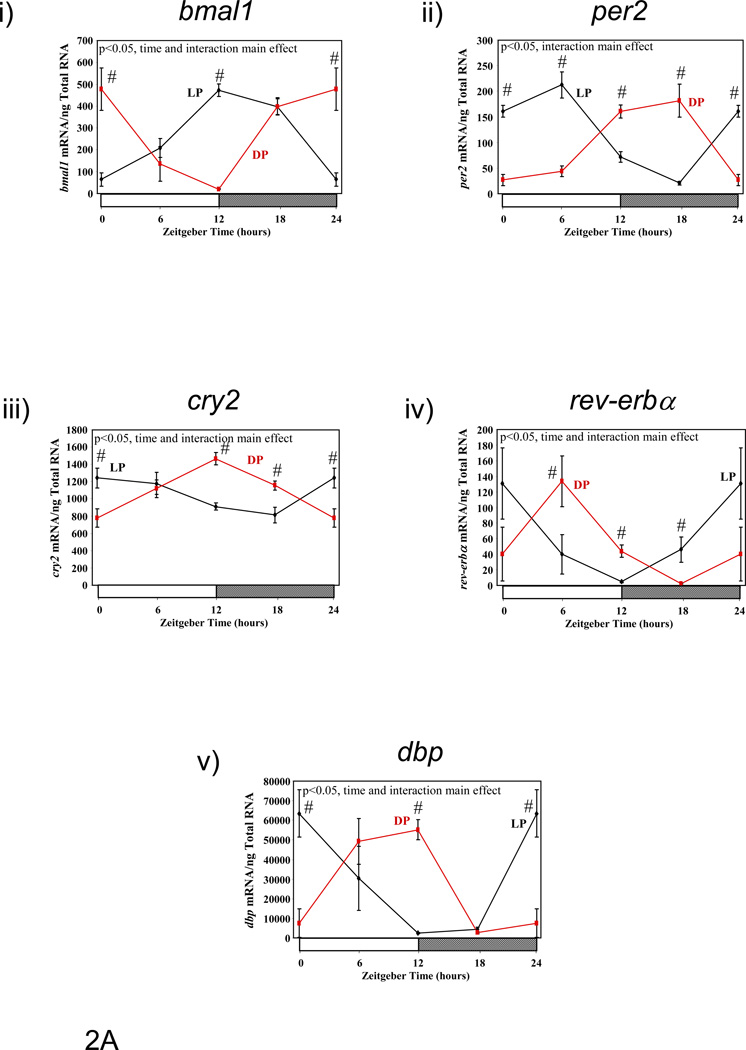
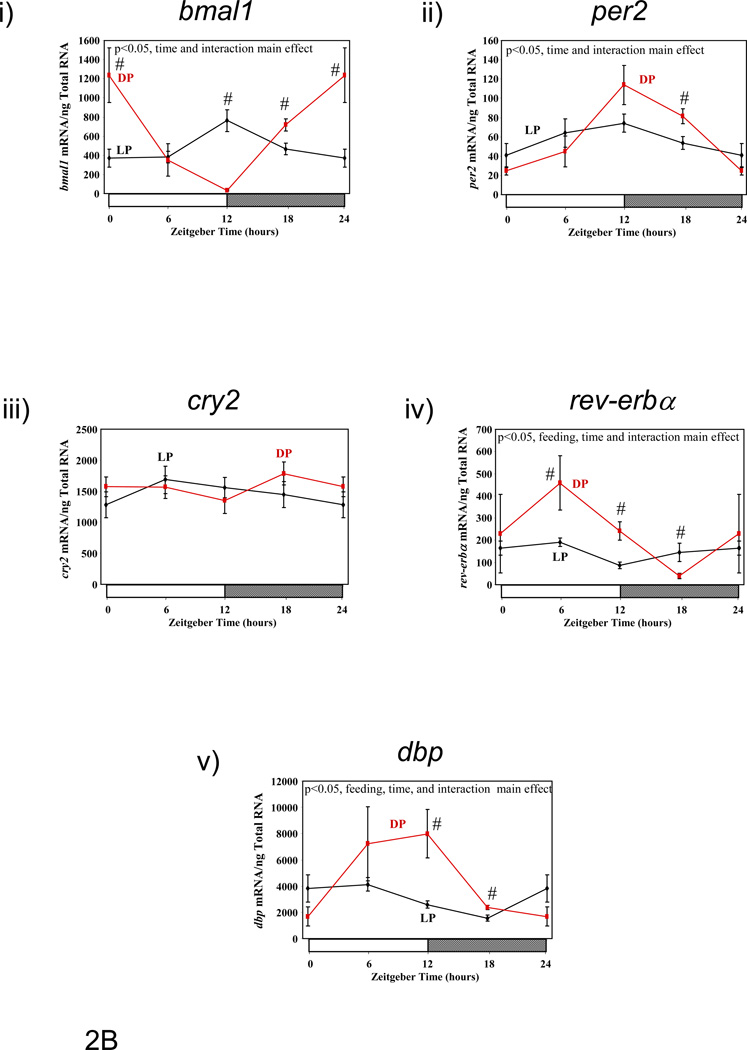
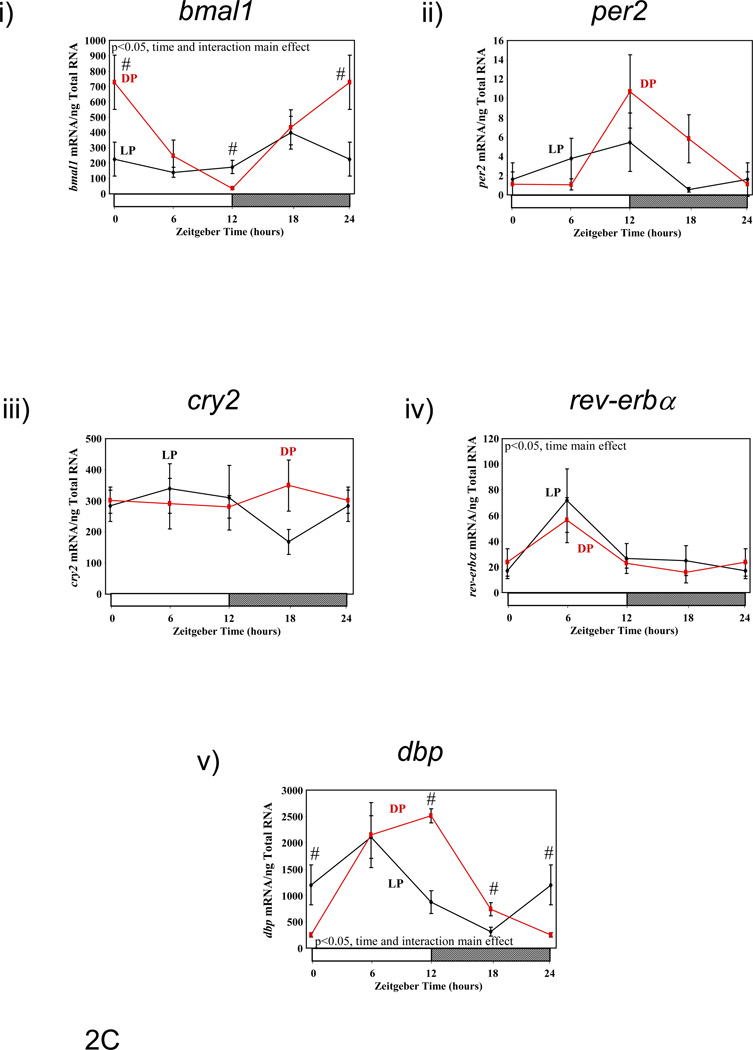
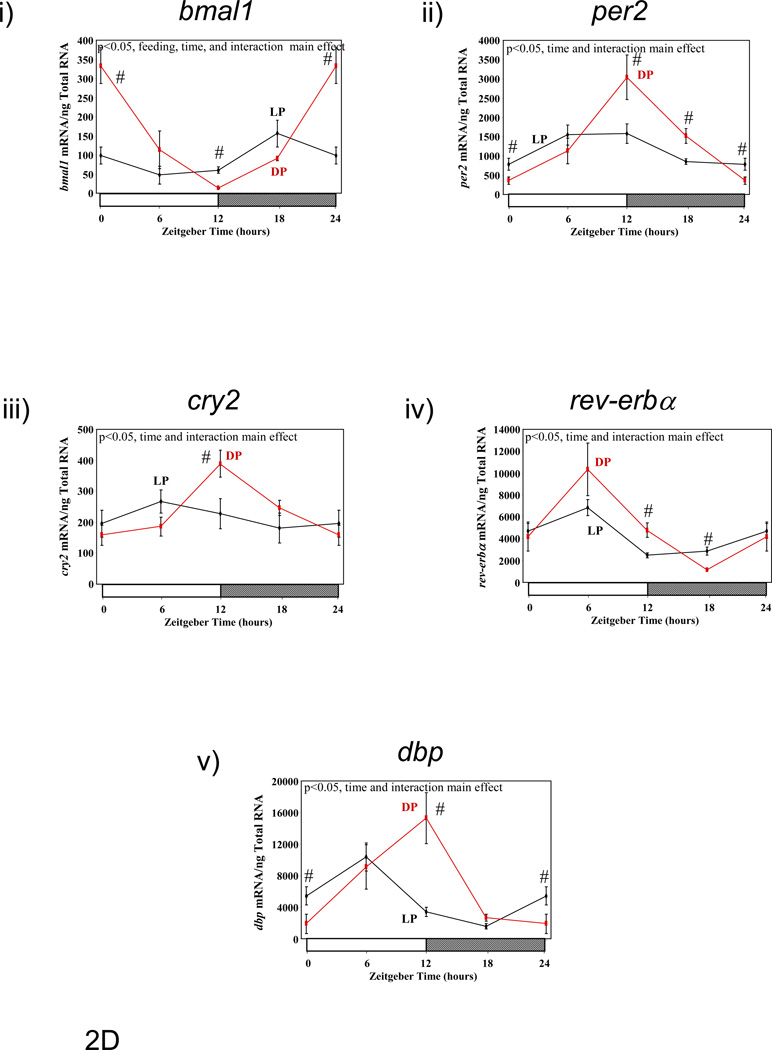
Figure 2.
Influence of restricted feeding on diurnal variations in circadian clock gene expression in liver (A), epididymal fat (B), gastrocnemius muscle (C), and heart (D). Mice were randomly assigned to dark phase (DP; n=21) or light phase (LP; n=23) restricted feeding groups. On the 9th day of restricted feeding, mice were euthanized at ZT0, ZT6, ZT12, or ZT18. Data are reported as mean ± SEM for between 4 and 6 independent observations. Data at ZT0 are plotted a second time at ZT24. Main effects for time and/or feeding regime are reported in the top left hand corner of the figure panels. #, p<0.05 for DP versus LP fed mice (post hoc pair-wise comparisons).


