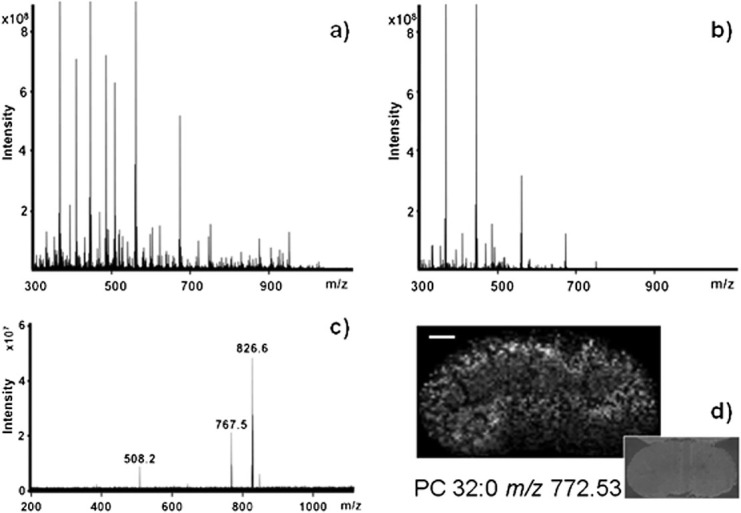
Figure 1.

Matrix-free LDI FTICR MSI data: (a) matrix-free LDI spectrum of mouse brain section collected from 200 laser shots, with a laser spot diameter of 30 μm; (b) matrix-free LDI spectrum of mouse kidney section collected from 200 laser shots, with a laser spot diameter of 50 μm; and (c) CID MS/MS spectrum from mouse brain section for the potassium salt adduct of phosphatidylcholine PC (36:2). Annotated are the m/z 826.6 precursor ion, as well as the product ion at m/z 767.5, resulting from the neutral loss of trimethylamine from the choline head group [M+K−59]+. The peak at m/z 508.2 corresponds to the loss of one of the side chains (theoretical C26H46O5PK, m/z 508.2714). (d) Spatial distribution of PC (32:0), m/z 772.5, across mouse kidney section at 100 μm raster. Scale bar 1 mm; insert is an optical image taken with a CCD camera on the macro lens.
