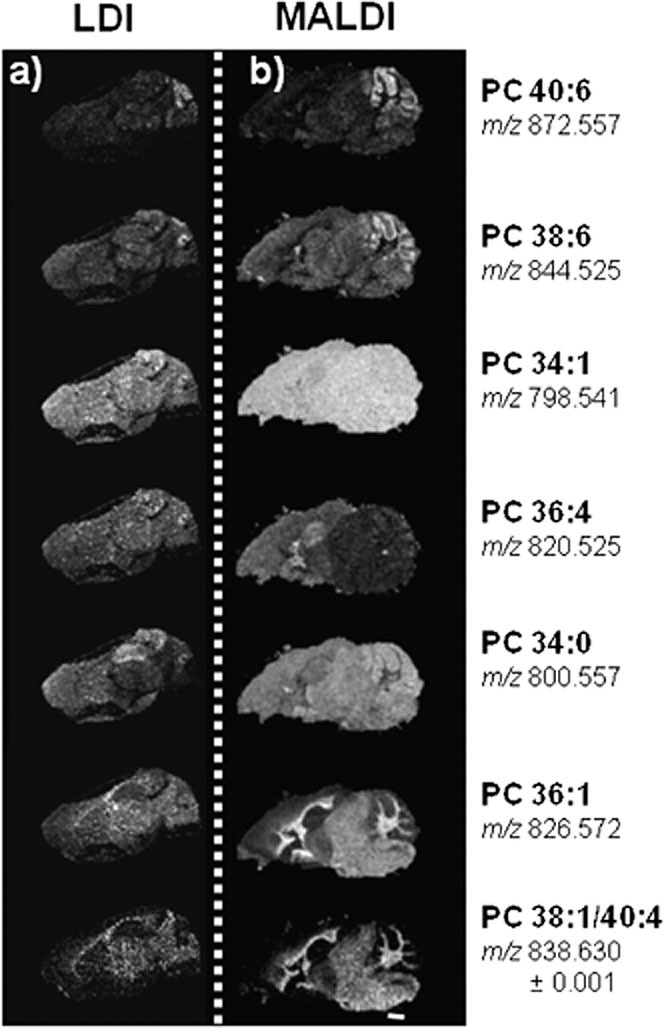
Figure 2.

Comparison of matrix-free LDI FTICR mass spectrometry images for phospholipid distributions across mouse brain section, with previously reported distributions obtained using MALDI TOF MSI. Scale bar 1 mm: (a) matrix-free LDI FTICR MSI data, 100 μm raster, mass window filter set to 0.001 m/z units; (b) MALDI TOF MSI data using solvent-free dry DHB matrix method, 100 μm raster, MALDI TOF. Reproduced from Puolitaival et al.[11]
