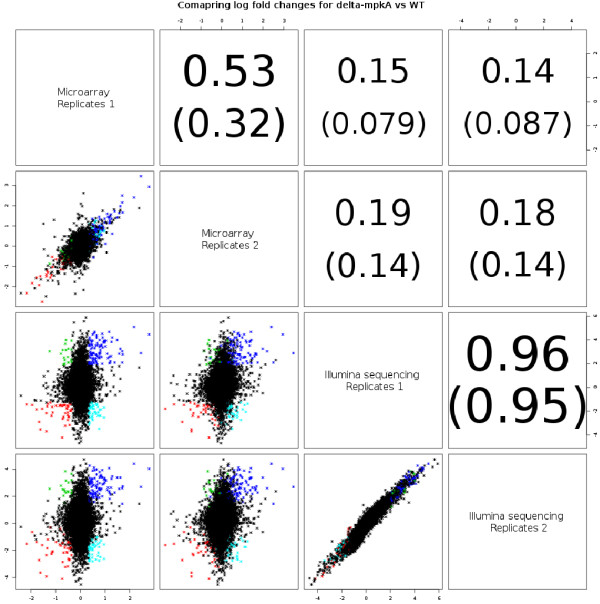
Figure 3.

Comparison of log2fold changes. Analysis of wt vs Δ mpkA mutant among and across both technologies (microarrays and mRNA-Seq). Genes are coloured blue if they were up-regulated (being in the 10% quantile of the genes with the highest fold-change) in both technologies (181 DEGs), red if down-regulated in both technologies (141), green if down-regulated on the arrays and up-regulated for sequence platform (70) and cyan for the opposite case (141).
