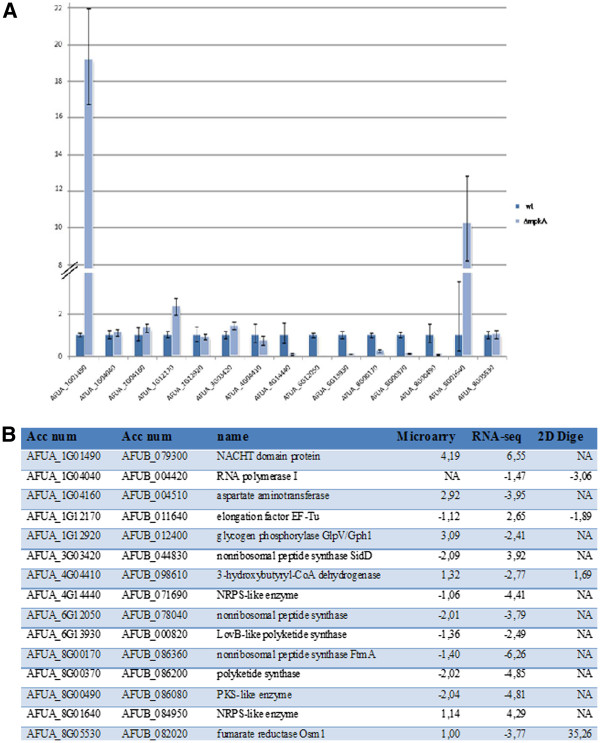
Figure 4.
Differentially expressed gene and protein abundances.A) qRT-PCR used to check genes that showed differential expression between wt and Δ mpkA strains during microarray, mRNA-Seq and 2D proteome analysis. The relative amount of transcripts was normalised by setting the value for each wt gene to 1; B) table listing the genes investigated with their respective fold change (Δ mpkA vs wt strains) during microarray, mRNA-Seq and 2D proteome analysis.

