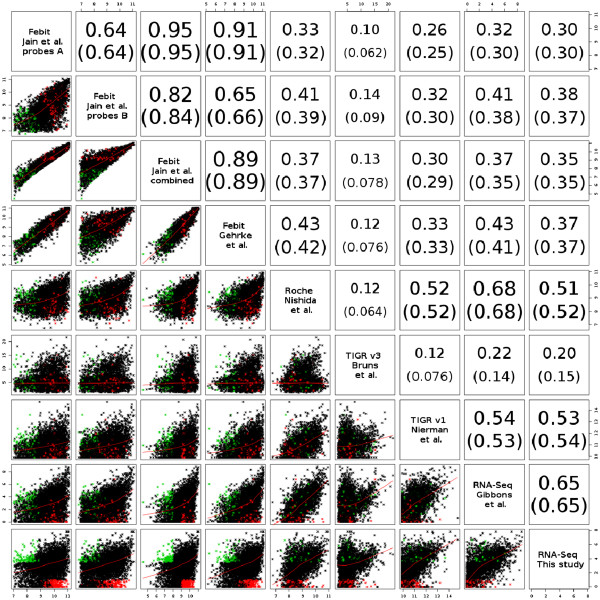
Figure 5.
Pair-wise scatterplot of transcriptome datasets. Pair-wise scatterplot of the absolute RNA expression values measured by several microarray platforms as well as mRNA-Seq: upper triangle, the pair-wise scatterplots; lower triangle, the corresponding Pearson correlation r (Spearman correlation coefficient rs in brackets) for each pair. A high correlation (with the maximum being one) indicates great agreement of expression between the datasets compared. The green (red) coloured dots correspond to genes that are highly (little) expressed in the mRNA-Seq data and little (highly) expressed in the microarray study of Jain el al. (2011) to check for bias due to the different technologies.

