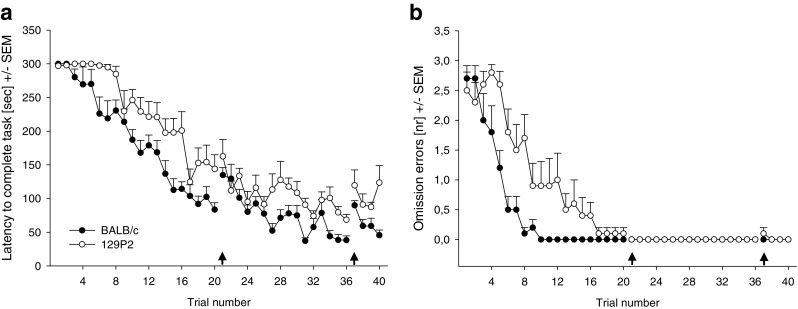
Fig. 2.

Cognitive parameters measured in BALB/c and 129P2 mice. Data are shown as averages per trial (four trials/day) ± SEMs. (A) Latencies to complete the task (i.e., all three food rewards found). (B) Number of omission errors (i.e., number of baited cylinders not visited). The first arrow indicates a break of 2 days; the second arrow indicates the reversal task (on Day 10)
