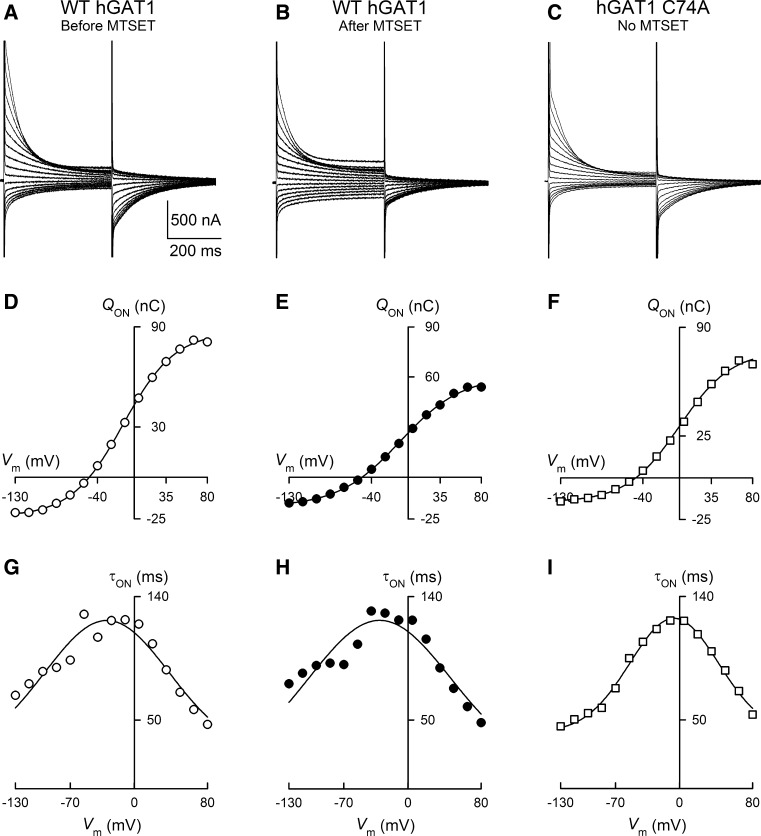
Fig. 8.
Presteady-state charge movements of WT GAT1 before and after sulfhydryl modification with MTSET. a–c Representative current relaxations are shown in response to 400-ms voltage pulses from +80 to −130 mV for WT GAT1 before (a) and after (b) treatment with MTSET (1 mM for 5 min) as well as for GAT1 C74A without MTSET treatment (c). Holding potential was −50 mV. d–f For each evoked current trace, time integration of the ON presteady-state currents yielded the total charge moved (Q ON) and, when plotted as a function of the test voltage, the Q–V relationship for WT GAT1 before (d) and after (e) labeling with MTSET as well as for GAT1 C74A (f). The smooth lines in (d–f) represent the fit of the data with a Boltzmann function (Eq. 3, see “Experimental Procedures” section). g–i Presteady-state currents monoexponentially decay to the zero level. The time constant plotted as a function of the test voltage yielded the τ–V relationship. The smooth lines in (g–i) represent the fit of the data with a gaussian function (Sacher et al. 2002). While MTSET treatment led to a reduction in the total charge moved (compare d and e), it had no effect on the midpoint of the Q–V relationship (V 0.5) and no effect on the relaxation time constants (compare g and h). The presteady-state parameters of GAT1 C74A were not different from those of WT GAT1. See text for additional details

