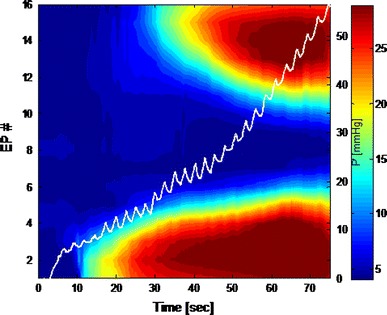
Fig. 3.

Color contour plot of the anal canal during a single inflation up to 50 ml. The white line represents the pressure within the bag (mmHg). The colors indicate the diameter present at a specific point in time at a specific electrode pair (EP). The red/brown colors show the large diameters of the bag in the rectum (top) and outside the anal verge (bottom). The first 30 s (x-axis) represents filling of the bag without distension of the anal canal. After that the dark blue color represents the closed part of the anal canal. After 30 s a change in diameter at the upper part is noticed (from dark blue to a lighter blue). The same curve is seen in the lower anal canal but with less steep a slope. The fully closed part of the anal canal (dark blue) shortens and after 70 s the mid-anal canal (at EP 8) is the only part to remain closed (dark blue)
