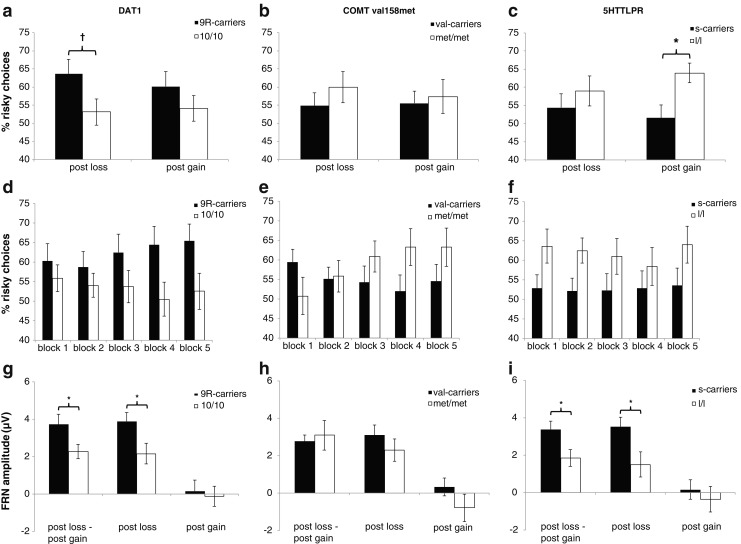
Fig. 1.

Behavioral and electrophysiological data from the gambling paradigm are depicted dependent on genetic polymorphisms within DAT1 (left), COMT val158met (center), and 5HTTLPR (right). (a–c) Average percentages of risky choices following losses and gains. (d–f) Time course of risk-taking behavior, displayed as average percentages of risky choices for the five blocks of the gambling task. (g–i) Amplitudes of the loss FRN, the gain FRN, and the loss FRN – gain FRN difference are shown. Error bars depict ±1 SEM. * p < .05. † p < .10
