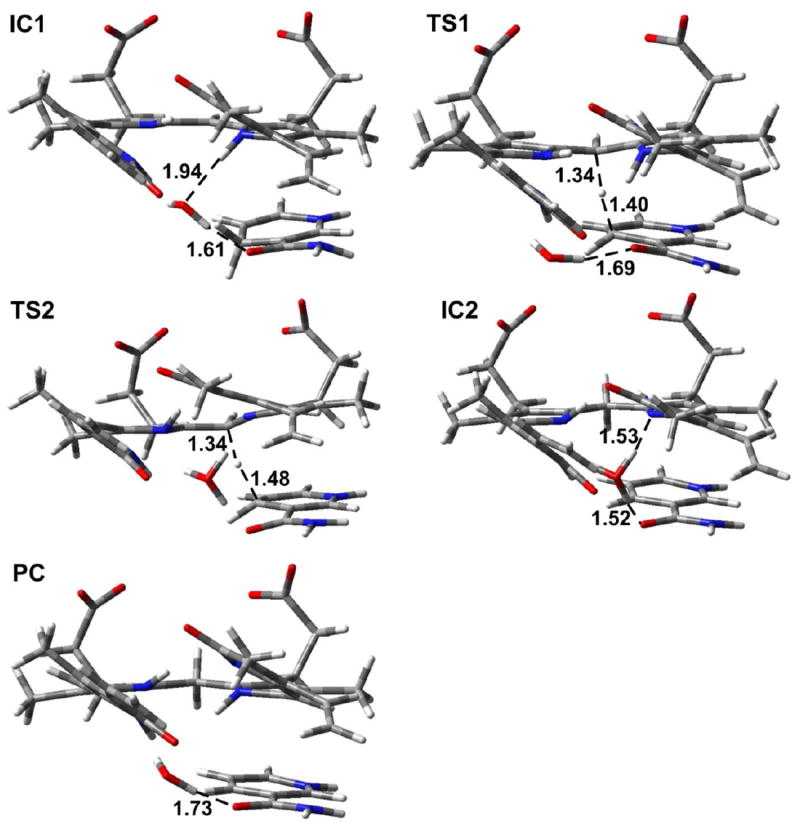
Figure 12.

The optimized structures of the intermediates (IC1 and IC2), transition states (TS1 and TS2) and product complex (PC) for Mechanism 1 and Mechanism 2 (substrate I). Distances are in angstrom (Å). Color key: C (gray); O (red); N (blue); and H (white).
